- AMC just cannot stop going up, nearly 17% on Thursday.
- AMC smashed out of its triangle resistance.
- AMC outperforms the broader market all week.
Update May 14: AMC Entertainment Holdings Inc (NYSE: AMC) has surged by over 24% on Thursday in response to the theater company's announcement that ist raised a whopping $428 million in a stock sale.Is there more in store? Premarket data for Friday suggests another surge of some 5% to above $13 on the last trading day of the week. The next big level to watch is $14.04, which was the high point in mid-March. As described below, the technical landscape is also favorable for AMC bulls.
Another day of gains for AMC as it notches for straight days of gains now. While everything else comes crashing down AMC rises nearly 3%. breaking $10 and turning increasingly bullish on the chart. Truly an impressive performance. Tuesday saw a lot of meme stocks rally as retail money exited Bitcoin and returned to meme stocks. Wednesday however was an ugly day, with the Nasdaq slipping nearly 3% and meme stocks suffering even heavier falls.
The drive for five is alive as AMC is up slightly in Thursday's premarket.
AMC stock news
AMC is a global cinema chain and, as a result, has struggled during the global pandemic as most of these cinemas have been closed for the better part of a year. The company narrowly avoided bankruptcy through the interest of retail traders. By strongly backing it, these retail traders allowed AMC to raise capital and debt, meaning it could survive the pandemic.
Recent results released on May 6, were the catalyst for the gain in AMC's share price. While the results were terrible the CEO was bullish in the post-results conference call and thanked the new retail, Reddit traders for supporting them. EPS was $-1.42 versus a forecast of $-1.26. Revenue was $147.4 million versus a $153.6 million forecast.
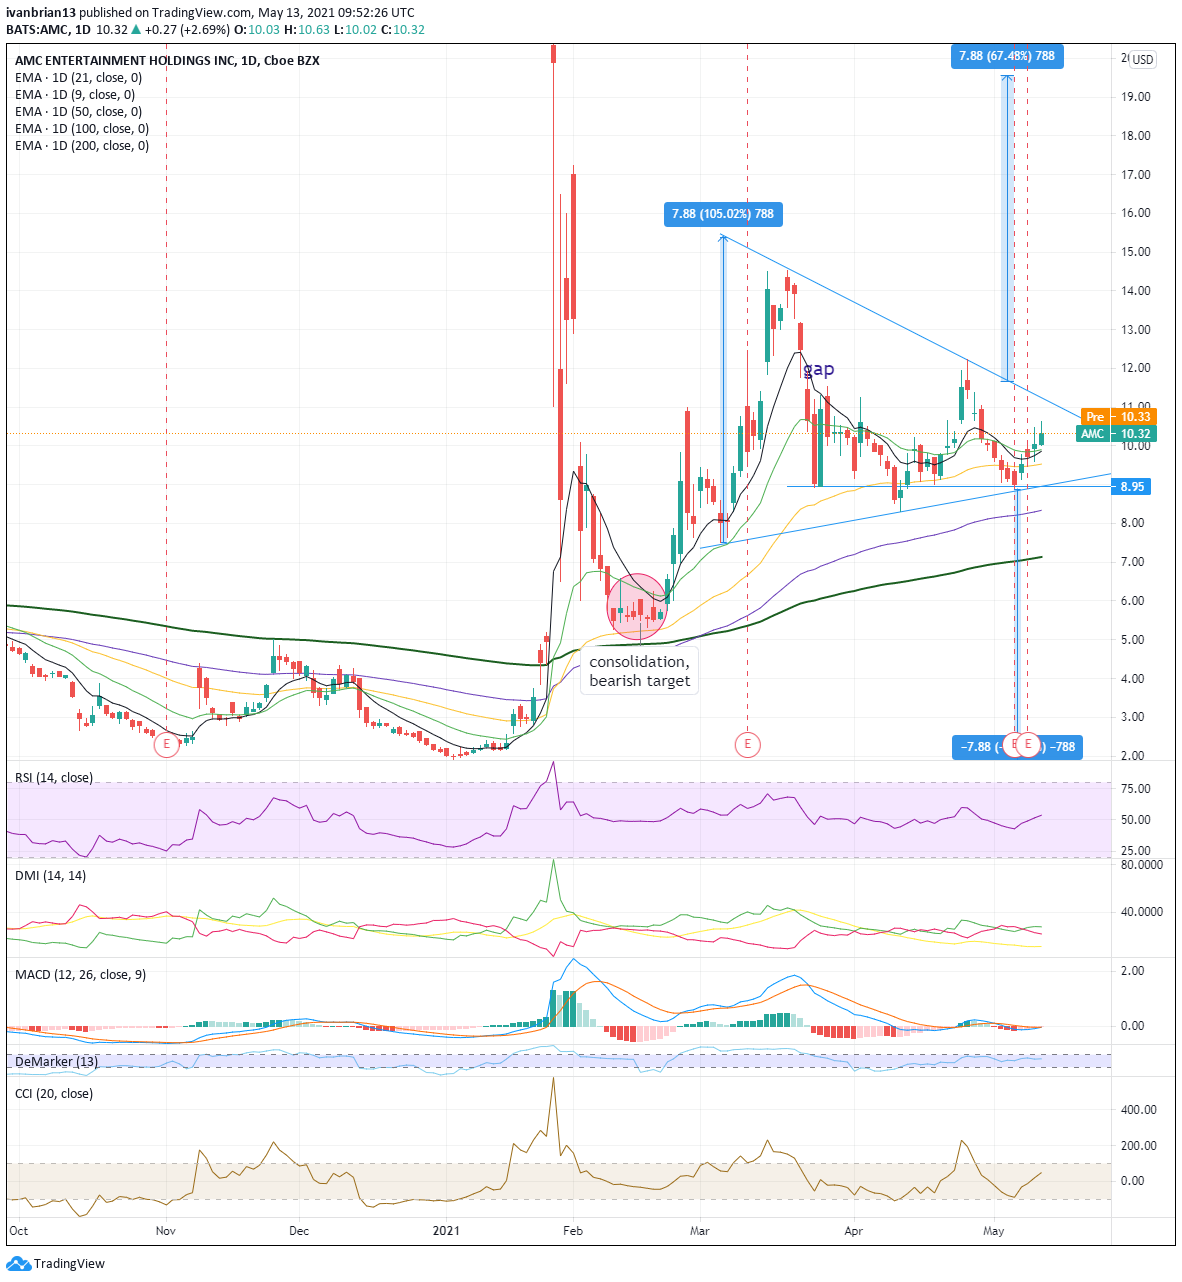
As of now, AMC is sitting above all key moving averages – 9, 21, 50 and 100-day. The Directional Movement Index is now crossed into a buy signal, although a weak one as the underlying trend identifier ADX is low. The Moving Average Convergence Divergence (MACD) is looking to crossover, keep an eye to confirm the trend.
The trend is bullish, AMC is not in a position to instigate new positions yet. A pullback to moving average support at $9.86 could be used with a tight stop or wait for $8.95. This area of support at $8.95 can be played for a long bounce or as a short as a break will probably be aggressive. The same can be done at $11.10 the top triangle line. A break could be accelerated so going long on a break can work or if you think the resistance will hold then it can be used to enter a short position (using put options maybe!).
There is a definite buy zone at $6, the consolidation area highlighted in the chart. Given the fundamentals, waiting to buy here for a bounce, but knowing the levels helps you trade your own view.
| Support | Resistance |
| 9.86-9.91 9 and 21 day MA | 11.10 |
| 9.53 | 12.22 |
| 8.95 | 14.54 |
| 7.14 200 day | 17.25 |
| 6 | 20.36 |
| 5.47 |
Previous updates
Update: A stunning breakout by AMC is an explosive move. AMC shares are up 17% on Thursday, breaking through $12. A beautiful triangle breakout now sees AMC target $14.54 and then $20. AMC had been signalling this move as it remained strong throughout the recent market turmoil.
At the time of writing, the author has no position in any stock mentioned in this article and no business relationship with any company mentioned. The author has not received compensation for writing this article, other than from FXStreet.
This article is for information purposes only. The author and FXStreet are not registered investment advisors and nothing in this article is intended to be investment advice. It is important to perform your own research before making any investment and take independent advice from a registered investment advisor.
FXStreet and the author do not provide personalized recommendations. The author makes no representations as to accuracy, completeness, or the suitability of this information. FXStreet and the author will not be liable for any errors, omissions or any losses, injuries or damages arising from this information and its display or use. The author will not be held responsible for information that is found at the end of links posted on this page.
Errors and omissions excepted.
Information on these pages contains forward-looking statements that involve risks and uncertainties. Markets and instruments profiled on this page are for informational purposes only and should not in any way come across as a recommendation to buy or sell in these assets. You should do your own thorough research before making any investment decisions. FXStreet does not in any way guarantee that this information is free from mistakes, errors, or material misstatements. It also does not guarantee that this information is of a timely nature. Investing in Open Markets involves a great deal of risk, including the loss of all or a portion of your investment, as well as emotional distress. All risks, losses and costs associated with investing, including total loss of principal, are your responsibility. The views and opinions expressed in this article are those of the authors and do not necessarily reflect the official policy or position of FXStreet nor its advertisers. The author will not be held responsible for information that is found at the end of links posted on this page.
If not otherwise explicitly mentioned in the body of the article, at the time of writing, the author has no position in any stock mentioned in this article and no business relationship with any company mentioned. The author has not received compensation for writing this article, other than from FXStreet.
FXStreet and the author do not provide personalized recommendations. The author makes no representations as to the accuracy, completeness, or suitability of this information. FXStreet and the author will not be liable for any errors, omissions or any losses, injuries or damages arising from this information and its display or use. Errors and omissions excepted.
The author and FXStreet are not registered investment advisors and nothing in this article is intended to be investment advice.


Recommended content
Editors’ Picks

EUR/USD bounces off lows, retests 1.1370
Following an early drop to the vicinity of 1.1310, EUR/USD now manages to regain pace and retargets the 1.1370-1.1380 band on the back of a tepid knee-jerk in the US Dollar, always amid growing optimism over a potential de-escalation in the US-China trade war.

GBP/USD trades slightly on the defensive in the low-1.3300s
GBP/USD remains under a mild selling pressure just above 1.3300 on Friday, despite firmer-than-expected UK Retail Sales. The pair is weighed down by a renewed buying interest in the Greenback, bolstered by fresh headlines suggesting a softening in the rhetoric surrounding the US-China trade conflict.

Gold remains offered below $3,300
Gold reversed Thursday’s rebound and slipped toward the $3,260 area per troy ounce at the end of the week in response to further improvement in the market sentiment, which was in turn underpinned by hopes of positive developments around the US-China trade crisis.

Ethereum: Accumulation addresses grab 1.11 million ETH as bullish momentum rises
Ethereum saw a 1% decline on Friday as sellers dominated exchange activity in the past 24 hours. Despite the recent selling, increased inflows into accumulation addresses and declining net taker volume show a gradual return of bullish momentum.

Week ahead: US GDP, inflation and jobs in focus amid tariff mess – BoJ meets
Barrage of US data to shed light on US economy as tariff war heats up. GDP, PCE inflation and nonfarm payrolls reports to headline the week. Bank of Japan to hold rates but may downgrade growth outlook. Eurozone and Australian CPI also on the agenda, Canadians go to the polls.

The Best brokers to trade EUR/USD
SPONSORED Discover the top brokers for trading EUR/USD in 2025. Our list features brokers with competitive spreads, fast execution, and powerful platforms. Whether you're a beginner or an expert, find the right partner to navigate the dynamic Forex market.