AMC Entertainment Holdings (AMC) Stock Price and Forecast: IS AMC ready to break out?
- AMC is ready to break out of triangle formation.
- AMC earnings were steady and helped the stock to stabilize.
- The entertainment company is still one of wallstreetbets top stocks despite Rivian taking attention.
AMC remains high on retail traders watchlists despite losing some of its lustre when compared to the new electric vehicle stocks. Rivian (RIVN) took over last week and Lucid Motors (LCID) remains a favourite name. Also, last week Canoo Group (GOEV) and Sono Group (SEV) took some investor attention away from the traditional meme stocks such as GameStop (GME) and AMC. The EV sector shows no sign of slowing down just yet and we can see the flatlining of AMC stock coinciding with the launch of Rivian (RIVN). But AMC remains well followed and with a potential triangle breakout pattern forming, the stock could see a return to favour with retail investors before the week is out.
-637731840444224660.png)
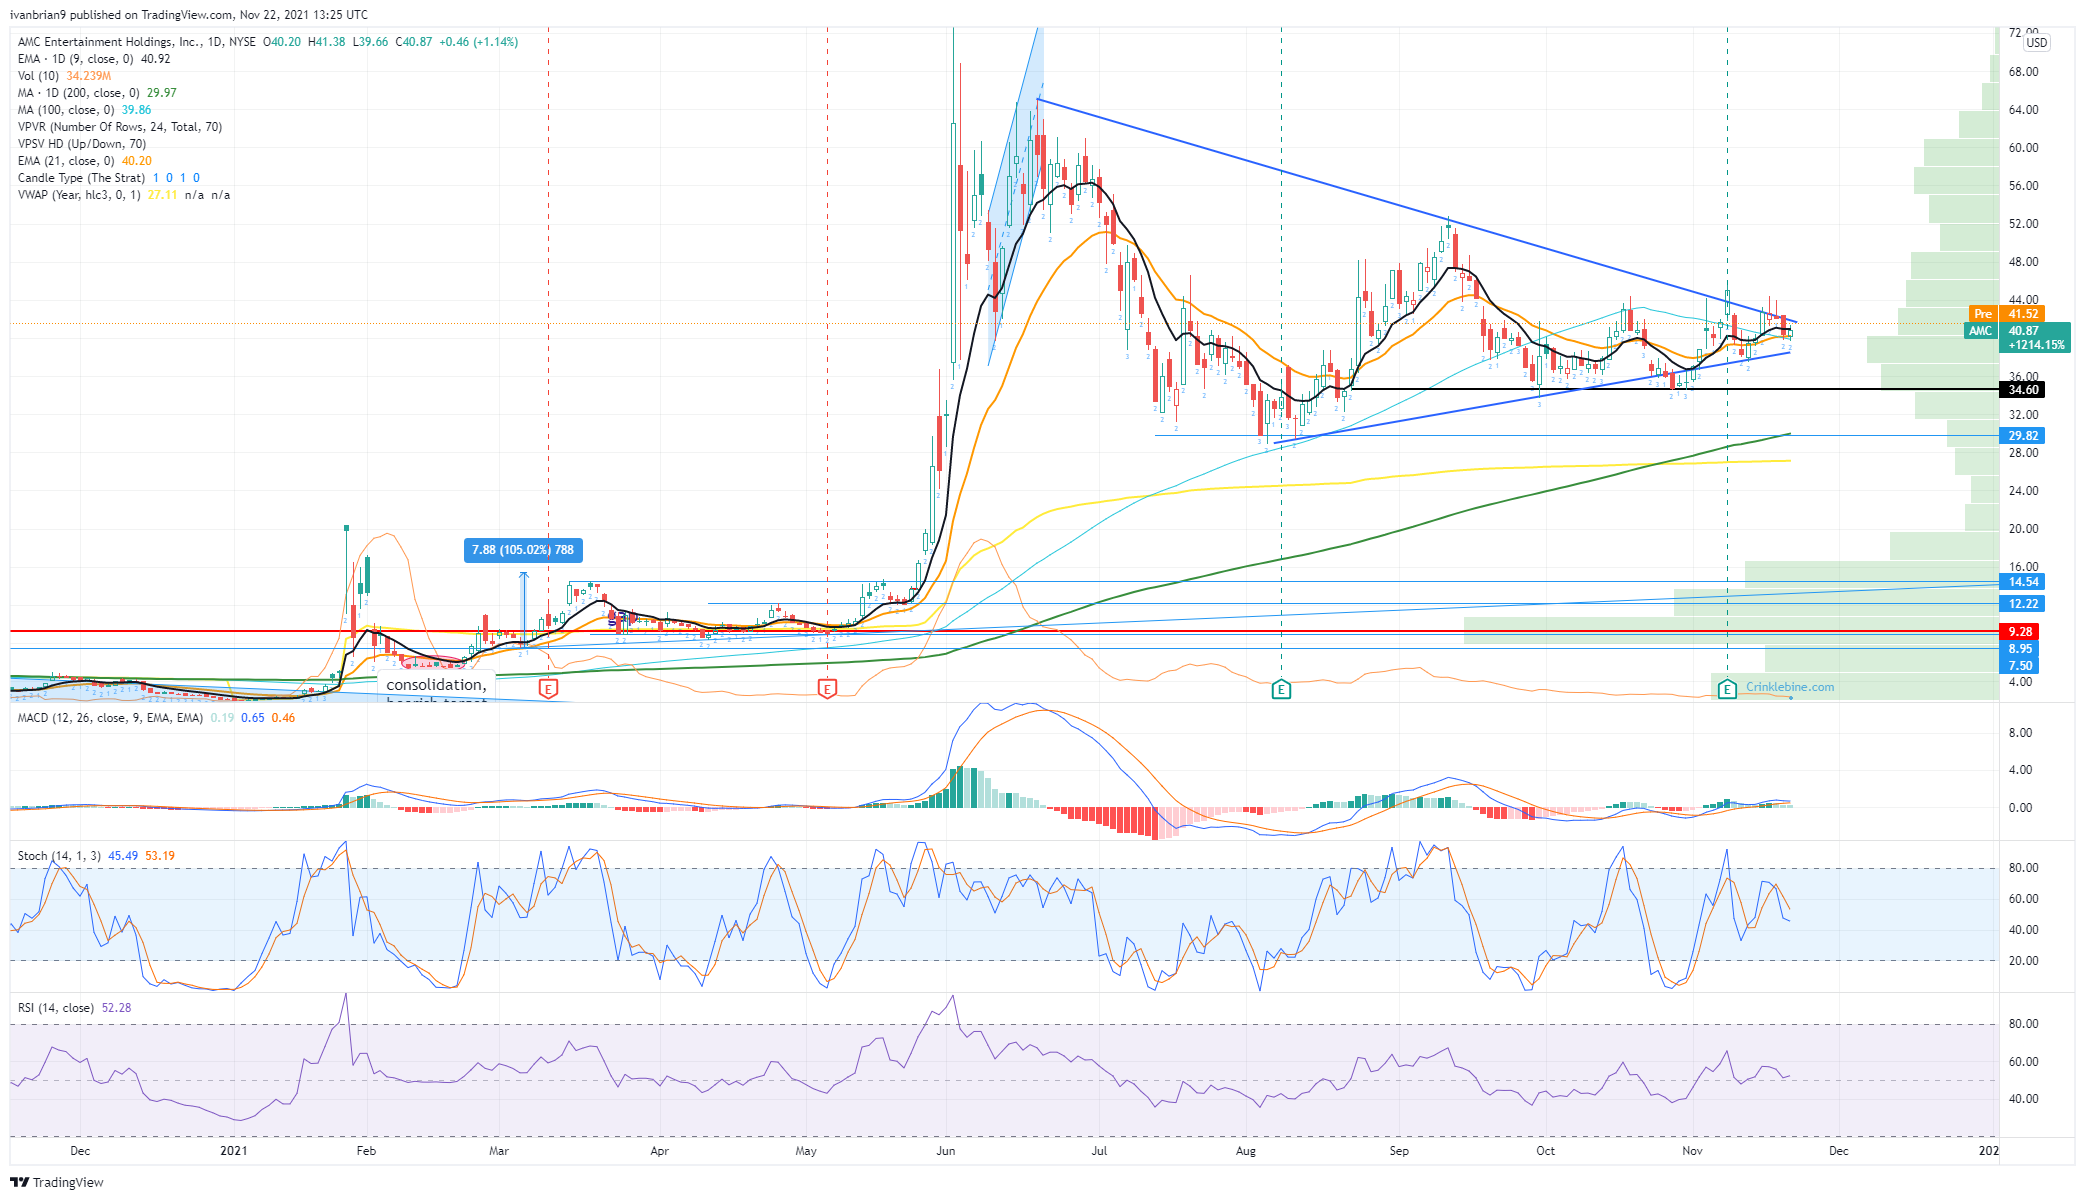
AMC graph, 15 minute
AMC stock news and forecast
AMC stock is currently stuck around $40 and has been steady around there for some time. The range has gradually decreased and is sticking to the triangle formation below. Triangle formations often lead to powerful breakouts so it is important to be ready if that does materialize and know the key levels to watch. Already the stock is trying to move higher in Monday's premarket with the AMC quote at $41.64. That still is not enough to cause the breakout but a step in the right direction.
AMC stock forecast
The last earnings report did not do much for the stock despite beating in the top and bottom lines. This stock has moved very far away from fundamentals so that comes as no surprise. This one is pure momentum. For now, momentum is lacking but as we know it can return explosively so it is best to be ready. The key level is $46 as this breaks the earnings high and is a powerful move out of the triangle. This will then open the door for a move to resistance at $52.79. Holding $34.60 is key to the downside. This keeps the series of higher lows intact. If $34.60 is broken then it will mean a quick move to test strong support at the 200-day moving average at $29.97.
Premium
You have reached your limit of 3 free articles for this month.
Start your subscription and get access to all our original articles.
Author

Ivan Brian
FXStreet
Ivan Brian started his career with AIB Bank in corporate finance and then worked for seven years at Baxter. He started as a macro analyst before becoming Head of Research and then CFO.


