- AMC shares, wowser is all one can say!
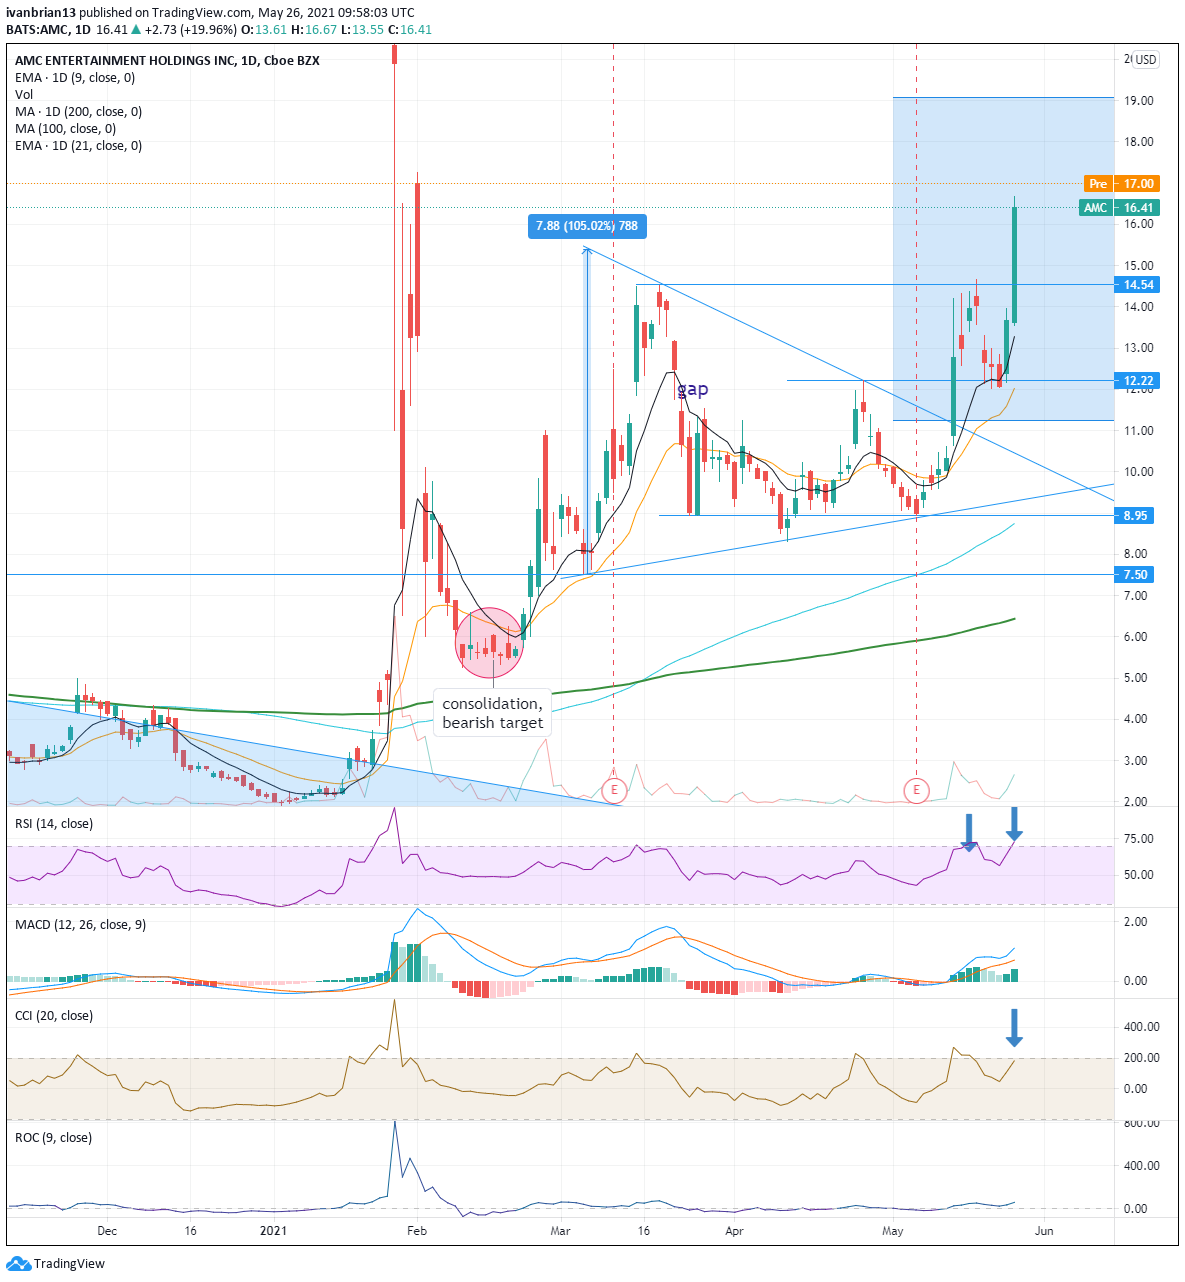
- The theater company stock smashes key resistance at $14.54.
- AMC shares surge nearly 20% to close at $16.41.
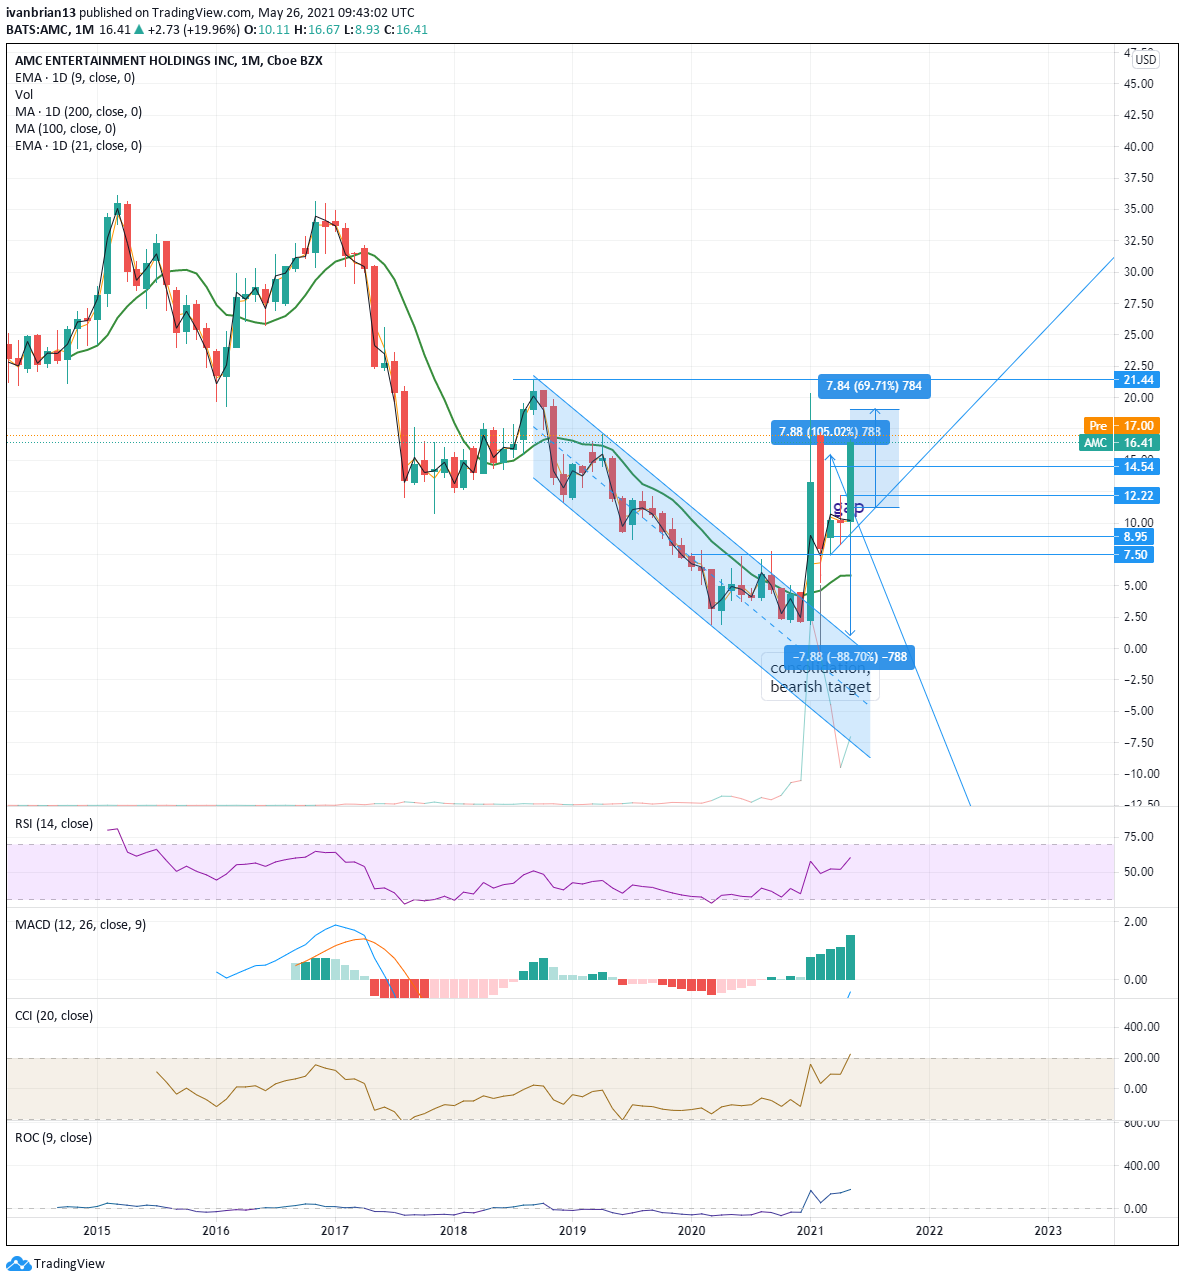
AMC to the moon might yet come true the way this one is going. Maybe AMC shareholders should petition Richard Branson to bring the company's logo on the next SPCE flight so it really can go to the moon. The way the shares are trading they just might manage it anyway. Tuesday saw an incredible 20% surge in the shares of the cinema operator. In the process, AMC shares smashed through the key resistance level at $14.54. This level had held the recent rise and looked to be proving difficult to break. Not so anymore, and now not much stands in the way of a test of recent highs from the original GameStop frenzy days back in January. The premarket on Wednesday is certainly indicating more to come with AMC trading above $17 early on.
AMC stock forecast
The monthly chart gives a much nicer view of the breakout and how well AMC shares have traded from a technical perspective. The breakout in January was confirmed with a surge in volume and an almost perfect retracement and retesting of the $7.50 breakthrough level. The monthly chart also shows the nice base around $2.50 that AMC had formed and defended multiple times.
The short-term daily chart gives a bit more detail on the move and the key levels to watch next. Taking out $14.54 was an extremely bullish move and sets up some intermediate resistance at $17.25, the high from Feb 1. Above there, AMC will test the r/wallstreetbets high of $20.36 and the next resistance level is the high from September 2018 at $21.44.
Now that $14.54 has broken it becomes key support and would like to hold to keep the bullish sentiment in place. This is clearly the dominant theme and the 9-day moving average has been signalling this perfectly. Some alarm bells are flashing again, though at the speed of the move.
AMC is no slouch and does not like to move slowly. But that does mean the momentum oscillators often show overstretched levels. The Relative Strength Index (RSI) is in overbought territory and the Commodity Channel Index (CCI) is just close to overbought.
The last time this occurred was on the May 13 explosion and it did lead to a gradual retracement of prices, so this needs to be watched closely. It is not saying the party and push for the moon is over but just that a retracement or consolidation is more likely. So long as AMC holds $8.95 it is still in a longer-term bullish trend of higher lows and higher highs.
Shorter term, $12.22 is the key to remaining in a bullish formation.
| Support | 14.54 | 12.22 | 9.40 trendline | 8.95 | 6.44 200-day |
| Resistance | 17.25 | 20.36 | 21.44 |
At the time of writing, the author has no position in any stock mentioned in this article and no business relationship with any company mentioned. The author has not received compensation for writing this article, other than from FXStreet.
This article is for information purposes only. The author and FXStreet are not registered investment advisors and nothing in this article is intended to be investment advice. It is important to perform your own research before making any investment and take independent advice from a registered investment advisor.
FXStreet and the author do not provide personalized recommendations. The author makes no representations as to accuracy, completeness, or the suitability of this information. FXStreet and the author will not be liable for any errors, omissions or any losses, injuries or damages arising from this information and its display or use. The author will not be held responsible for information that is found at the end of links posted on this page.
Errors and omissions excepted.
Information on these pages contains forward-looking statements that involve risks and uncertainties. Markets and instruments profiled on this page are for informational purposes only and should not in any way come across as a recommendation to buy or sell in these assets. You should do your own thorough research before making any investment decisions. FXStreet does not in any way guarantee that this information is free from mistakes, errors, or material misstatements. It also does not guarantee that this information is of a timely nature. Investing in Open Markets involves a great deal of risk, including the loss of all or a portion of your investment, as well as emotional distress. All risks, losses and costs associated with investing, including total loss of principal, are your responsibility. The views and opinions expressed in this article are those of the authors and do not necessarily reflect the official policy or position of FXStreet nor its advertisers. The author will not be held responsible for information that is found at the end of links posted on this page.
If not otherwise explicitly mentioned in the body of the article, at the time of writing, the author has no position in any stock mentioned in this article and no business relationship with any company mentioned. The author has not received compensation for writing this article, other than from FXStreet.
FXStreet and the author do not provide personalized recommendations. The author makes no representations as to the accuracy, completeness, or suitability of this information. FXStreet and the author will not be liable for any errors, omissions or any losses, injuries or damages arising from this information and its display or use. Errors and omissions excepted.
The author and FXStreet are not registered investment advisors and nothing in this article is intended to be investment advice.
Recommended content
Editors’ Picks

EUR/USD falls as Wall Street turns red
EUR/USD turned bearish as Wall Street gives up and major indexes turn red. The pair trades near a fresh weekly low in the 1.0460 price zone. Earlier in the day, the European Central Bank trimmed interest rates as expected, and the United States published discouraging employment and inflation-related data.

GBP/USD dips below 1.2700 as US Dollar surges on risk aversion
GBP/USD finally broke below the 1.2700 mark in the American session, as sentiment shifted to the worse, following dismal US employment and inflation-related data. The poor performance of stocks and an uptick in Treasury yields boost demand for the US Dollar.

Gold could extend its corrective slide
XAU/USD fell towards $2,680 and remains under pressure as investors diggest US figures and the European Central Bank monetary policy announcement. Inflation in the US at wholesale levels rose by more than anticipated in November, according to the latest Producer Price Index release.
-637336005550289133_Medium.jpg)
Chainlink surges amid World Liberty purchase, Emirates NBD partnership and CCIP launch on Ronin network
Chainlink price surges around 15% on Thursday, reaching levels not seen since mid-November 2021. The rally was fueled by the Donald Trump-backed World Liberty Financial purchase of 41,335 LINK tokens worth $1 million on Thursday.

Can markets keep conquering record highs?
Equity markets are charging to new record highs, with the S&P 500 up 28% year-to-date and the NASDAQ Composite crossing the key 20,000 mark, up 34% this year. The rally is underpinned by a potent mix of drivers.

Best Forex Brokers with Low Spreads
VERIFIED Low spreads are crucial for reducing trading costs. Explore top Forex brokers offering competitive spreads and high leverage. Compare options for EUR/USD, GBP/USD, USD/JPY, and Gold.

