Amazon Inc. (AMZN) stocks Elliott Wave technical analysis [Video]
![Amazon Inc. (AMZN) stocks Elliott Wave technical analysis [Video]](https://editorial.fxsstatic.com/images/i/Public-Figures_Jeff-Bezos_2_XtraLarge.jpg)
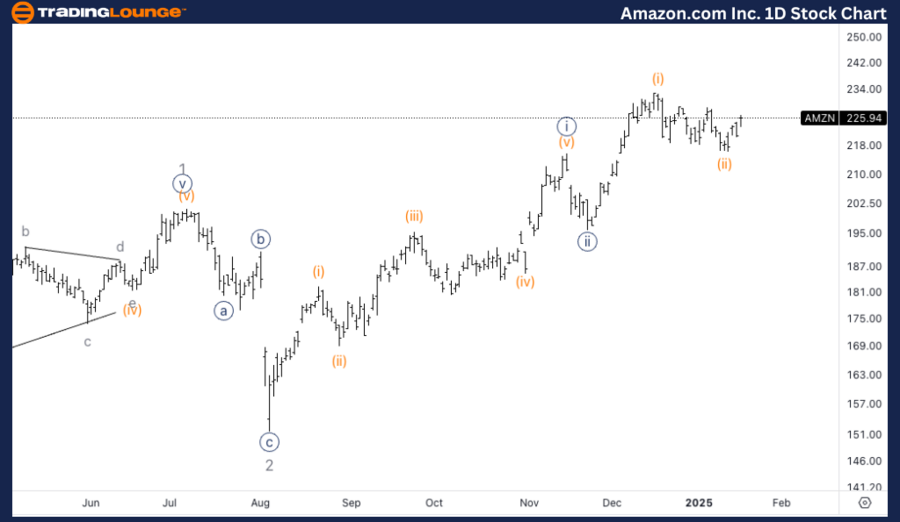
AMZN Elliott Wave Analysis Trading Lounge Daily.
Amazon Inc., (AMZN) Daily Chart.
AMZN Elliott Wave technical analysis
Function: Trend.
Mode: Impulsive.
Structure: Motive.
Position: Minor wave 3.
Direction: Upside within wave 3.
Details: We are looking at further upside into wave 3 as we seem to have complete wave {!}-{ii} at around TradingLevel2 at 200$ and we are now continuing higher in what should be Minute wave {iii}.
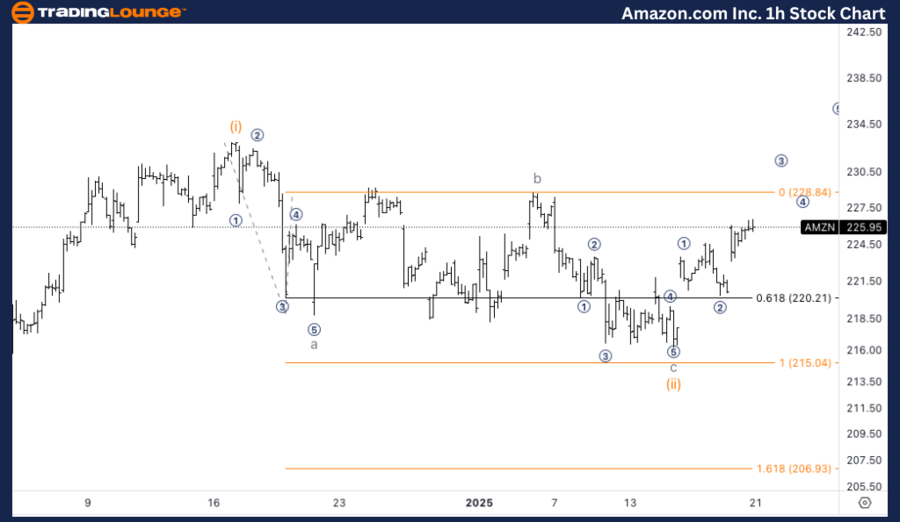
Amazon Inc., (AMZN) 1H Chart
AMZN Elliott Wave technical analysis
Function: Trend.
Mode: Impulsive.
Structure: Motive.
Position: Wave I of (iii).
Direction: Upside into wave (iii).
Details: Looking for continuation higher at 220$ to have additional confirmation of upside resumption as we seem to have a clear three wave move subdivision in wave (ii).
This Elliott Wave analysis for Amazon.com Inc., (AMZN) examines both the daily and 1-hour charts to assess its current market trend, utilizing Elliott Wave Theory to anticipate potential future movements.
AMZN Elliott Wave technical analysis – Daily chart
We anticipate further upside movement within Minor wave 3. After completing waves {!}-{ii} around TradingLevel2 at $200, we are now progressing higher in what should be Minute wave {iii}, continuing the uptrend. The structure remains strong, indicating further bullish momentum as wave 3 unfolds.
AMZN Elliott Wave technical analysis – One-hour chart
We are looking for continued upward movement towards $220, which would provide additional confirmation of the uptrend resumption. The wave (ii) subdivision shows a clear three-wave move, and breaking above $220 will further solidify the bullish outlook.
Technical analyst: Alessio Barretta.
AMZN Elliott Wave technical analysis [Video]
Author

Peter Mathers
TradingLounge
Peter Mathers started actively trading in 1982. He began his career at Hoei and Shoin, a Japanese futures trading company.