Amazon (AMZN) Stock Forecast: Internet's biggest retailer likely to break $2,000, head for $1,700
- Amazon lost more than 7% on Wednesday due to Target guidance.
- Inflation has been hitting retail earnings hard.
- Expect AMZN stock to break through $2,000 level fairly soon.

Amazon (AMZN) stock, a more defensive play for most of this year's bear market, lost more than 7% on Wednesday due to an overall weak retail outlook. A view of AMZN's stock chart points to plenty of more pain to come, and FXStreet expects it will soon break below $2,000. On Thursday AMZN rebounded a bit from the prior session only to close just 0.2% higher at $2,146 and change. This common habit of large-cap stocks rebounding in the early part of the session only to sell off near the end is a sign that bulls lack faith.
Amazon Stock Analysis: A weak second half
In the first half of the year, AMZN acted somewhat like a defensive stock, remaining largely flat through March 29 as the rest of the tech market, but primarily smaller high-growth names, got hammered. Once April reared its head, however, Amazon stock joined the pity party and lost as much as 40% in the ensuing 30 sessions. The stock has fallen from a range high of $3,416 on March 29 to a May 12 low at $2,048. So now is the time to scoop it up at a discount, right?
Probably not. The May 12 low did perfectly bounce off the 0 Fibonacci level, but the important point is that AMZN even reached that level in the first place. Typically in normal corrections, large-cap stocks tend to bounce or find support at either the 38.2% or 23.6% levels. Both the zero and 50% levels are not really Fibonacci levels but more like place markers. Second, Amazon's retail brethren are all showing the same problem. Supplier prices are going up and beginning to infiltrate margins.
Both Walmart (WMT) and Target (TGT) presented first quarter earnings earlier this week that missed profit expectations due to higher supplier prices that could not be counteracted with higher retail prices. Inflation is all around the retail sector, from higher transportation costs to expanding salaries. Target's operating profit was cut in half. Its gross margin dropped from 30% a year ago to 25.7%. Earnings per share missed forecasts by 28%.
There is no reason to believe that this inflationary moment will pass Amazon on by. It is true that revenue derived from third-party sellers gives Amazon a better stance, but executives from its peers have both said they expect higher prices to change consumer behaviour, i.e. people spending less than usual. Amazon reports its next quarter at the end of July, so there is some time before we find out how much inflation is biting into profits.
With AMZN's TTM EV/EBITDA multiple trading about 2.5 times its retail sector median valuation, the ecommerce powerhouse definitely has room to fall. This is especially the case if a full-blown recession hits in the second half of the year. The Federal Reserve's aggressive rate hikes are expected to do just that in a bid to squash inflation. Goldman Sachs and various other prognosticators of note are already forecasting a recession in either the second half of this year or the first half of 2023. It sure seems like this environment is a bad time to own stocks in general and retail specifically.
Amazon Stock Forecast: $1,700 beckons
As you can see in the daily chart below, the 9-day moving average has been acting as resistance for nearly two months now. Though AMZN shares broke through with this week's recent mini bebound, the stock quickly sold off once it closed above the 9-day. Price action seems notably weak when you realize AMZN has not touched the 21-day moving average since April 7.
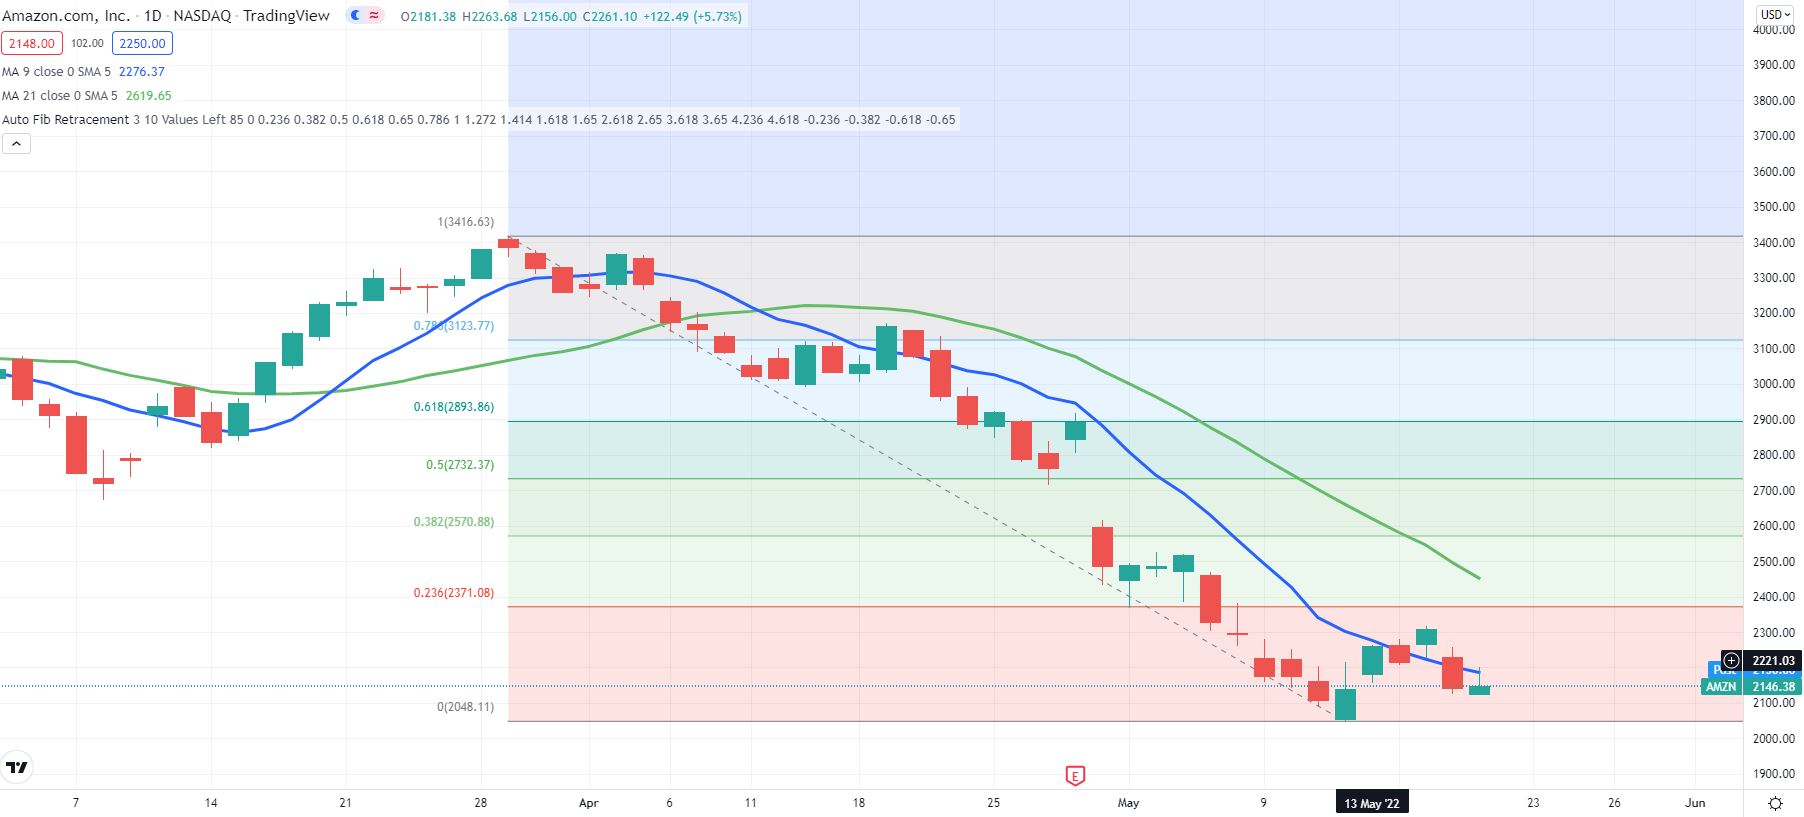
AMZN 1-day chart
The weekly chart below offers even more insight. Here the weekly Fibonacci chart shows Amazon stock completely tearing through the 0 lower bound all the way back at $2,671. It is likely to follow suit on the daily chart before the next earnings arrive. Both the Moving Average Convergence Divergence (MACD) indicator and the Relative Strength Index (RSI) point to the nosedive continuing.
The MACD line (blue) needs to close the space between its signal line (orange) and also break above 0. Neither of which seem like they are in the cards in the near future. The RSI is reading 25 on the weekly chart. This is typically an oversold level, but in the event of a poor earnings call or growing recessionary fears, it could easily drop to 20 or below.
Overall, I would not jump back into AMZN until price action closes above $2,461 on the weekly chart. That level showed resistance as recently as April and May 2020. Though $2,000 is an important pschylogical level that many bulls and value investors may think of as strong support, the psychology and technical analysis seen throughout the market in this moment mean $2,000 does not stand a chance. $2,026 offers better support as it acted as resistance for nearly a year in 2018 and 2019, but I cannot see it holding up in these stormy waters. A better entry point might be $1,700 though. If you pay attention to this level closely over the past few years, you can see how it has acted in general as both resistance and support on nearly a dozen separate occasions between 2018 and 2020. This is a much better bet for longs.
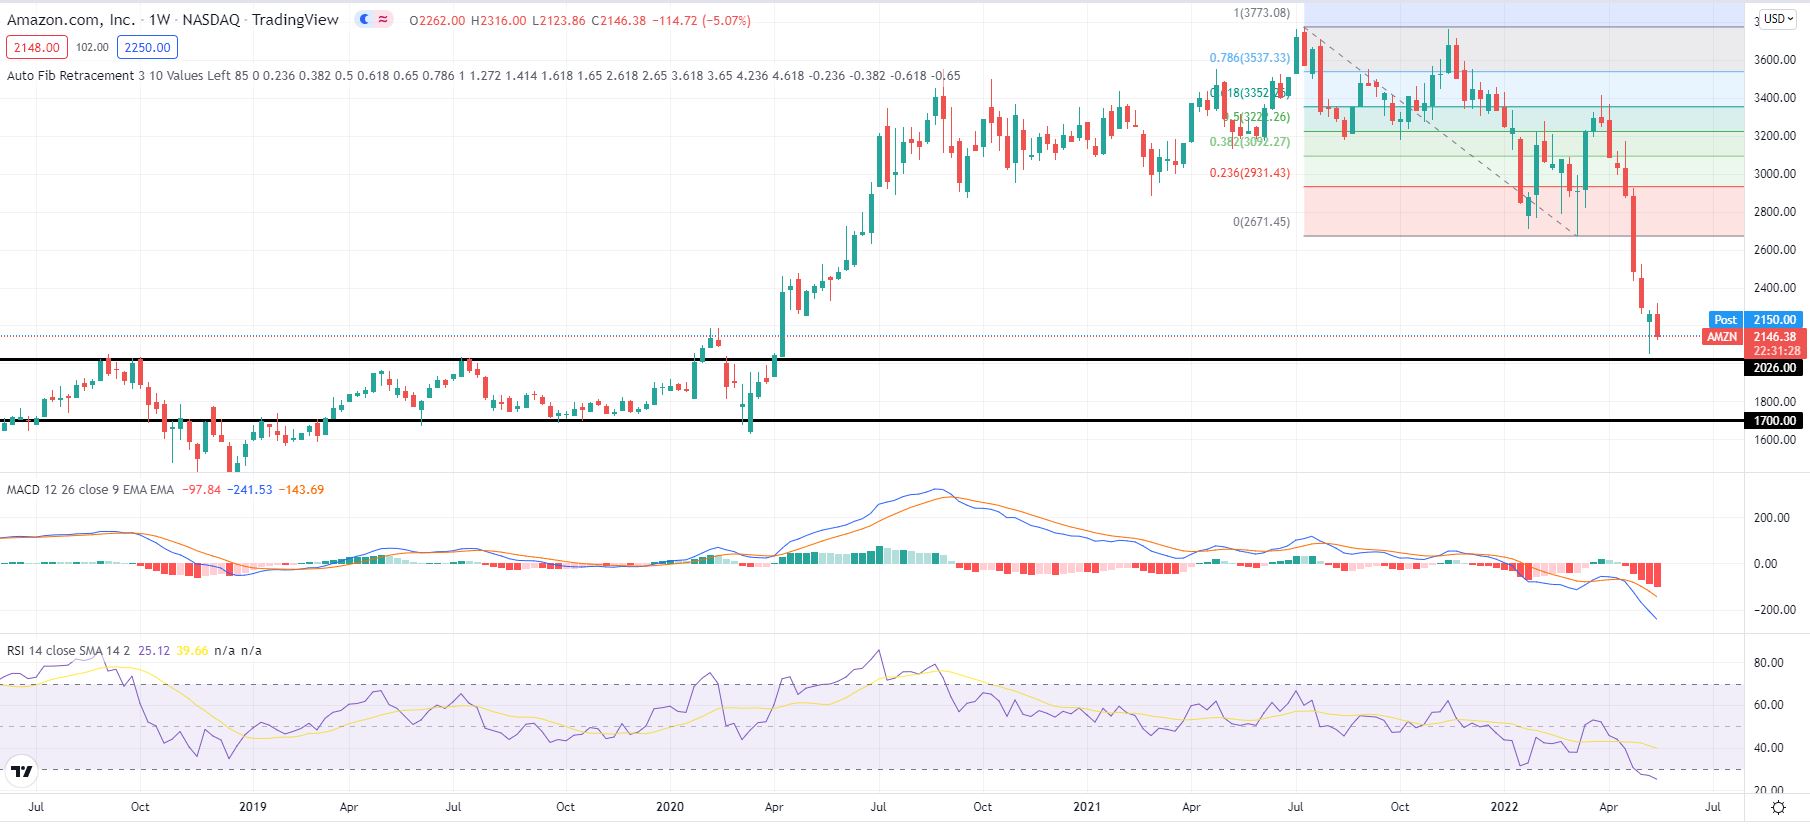
AMZN weekly chart
Like this article? Help us with some feedback by answering this survey:
Premium
You have reached your limit of 3 free articles for this month.
Start your subscription and get access to all our original articles.
Author

Clay Webster
FXStreet
Clay Webster grew up in the US outside Buffalo, New York and Lancaster, Pennsylvania. He began investing after college following the 2008 financial crisis.