Alphabet Inc. (GOOGL) Stocks Elliott Wave technical analysis [Video]
![Alphabet Inc. (GOOGL) Stocks Elliott Wave technical analysis [Video]](https://editorial.fxsstatic.com/images/i/Economic-Indicator_Recession-5_XtraLarge.png)
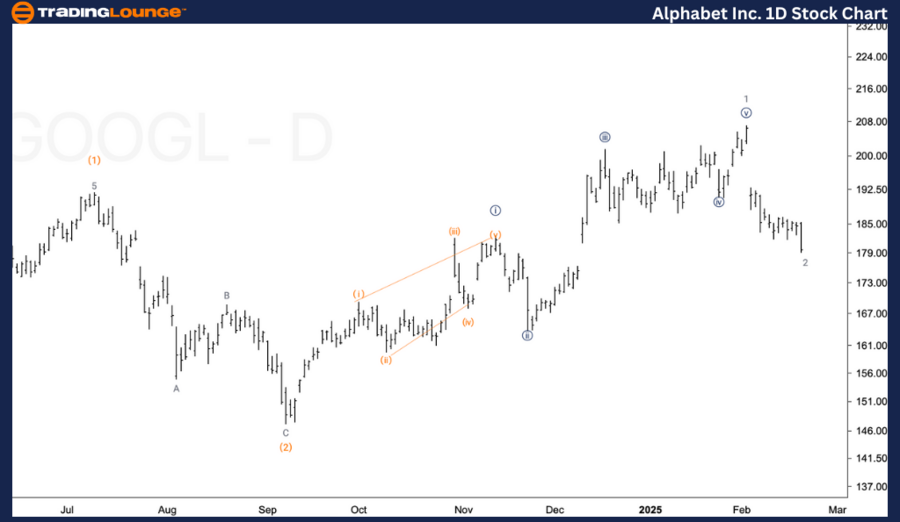
GOOGL Elliott Wave Analysis – Trading Lounge Daily Chart.
Alphabet Inc. (GOOGL) – Daily Chart.
GOOGL Elliott Wave technical analysis
-
Function: Trend.
-
Mode: Impulsive.
-
Structure: Motive.
-
Position: Minor Wave 1.
-
Direction: Bottom in Wave 2.
Details:
-
A sharp pullback is expected in Minor Wave 2 after a top in wave 1 of (3).
-
Possibility that wave (1) may need to be repositioned, potentially signaling a larger correction.
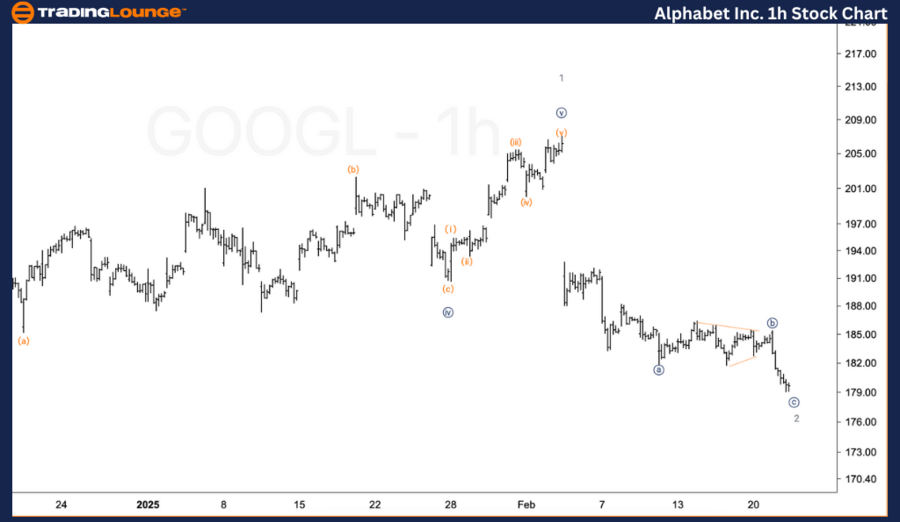
GOOGL Elliott Wave Analysis – Trading Lounge 1H Chart.
Alphabet Inc. (GOOGL) – 1H Chart.
GOOGL Elliott Wave technical analysis
-
Function: Trend.
-
Mode: Impulsive.
-
Structure: Motive.
-
Position: Wave {c} of 2.
-
Direction: Bottom in Wave 2.
Details:
-
Looking for a potential bottom in wave 2, either already in place or forming soon.
-
A three-wave move in wave 2 is visible, suggesting the end of the current corrective phase.
GOOGL Elliott Wave technical analysis – Summary
Daily chart
-
GOOGL is in an impulsive trend within a motive structure, currently observing a correction in Minor Wave 2.
-
After reaching a top in wave 1 of (3), the stock is undergoing a sharp pullback, possibly indicating the beginning of a larger corrective phase.
-
Wave 2 pullback should ideally set the stage for the next upside movement once completed.
1H chart
-
GOOGL is nearing the completion of wave {c} of 2, marking the end of the current corrective phase.
-
A three-wave structure is forming in wave 2, suggesting a potential bottom is either already in place or developing soon.
-
This could signal the start of a new impulsive wave in the next upward trend.
Technical analyst: Alessio barretta.
GOOGL Elliott Wave technical analysis [Video]
Author

Peter Mathers
TradingLounge
Peter Mathers started actively trading in 1982. He began his career at Hoei and Shoin, a Japanese futures trading company.


