Alphabet Inc.(GOOGL) Elliott Wave technical analysis [Video]
![Alphabet Inc.(GOOGL) Elliott Wave technical analysis [Video]](https://editorial.fxsstatic.com/images/i/Computer-with-Chart_3_XtraLarge.png)
GOOGL Elliott Wave technical analysis
Function: Trend.
Mode: Impulsive.
Structure: Motive.
Position: Minor wave 1.
Direction: Upside within wave {v} of 1.
Details: We are looking for upside into wave 1 of (3), which is our more conservative approach. As we are trading just around 200$ we would not be surprised to see a larger pullback in what could be wave 2.
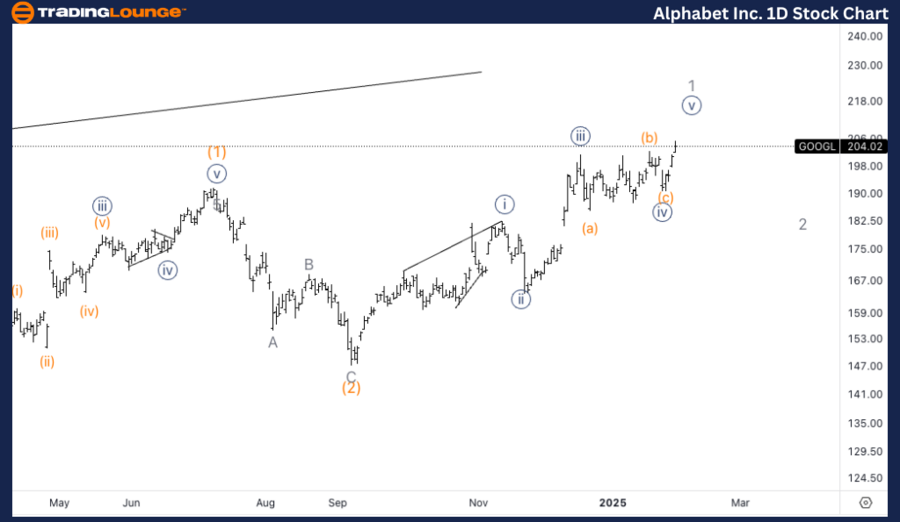
GOOGL Elliott Wave technical analysis – Daily chart
Alphabet Inc. (GOOGL) is currently experiencing an upside move in wave 1 of (3), following a more conservative approach. As the stock trades near the $200 level, there is a potential for a larger pullback, likely forming wave 2. This suggests that a near-term correction could occur before the next bullish phase begins.
GOOGL Elliott Wave technical analysis
Function: Trend
Mode: Impulsive
Structure: Motive
Position: Wave (iii) of {v}.
Direction: Top in wave {v}.
Details: Looking for upside into wave {v}, the support found on the parallel trend channel seems to provide us with additional confidence on the overall count.
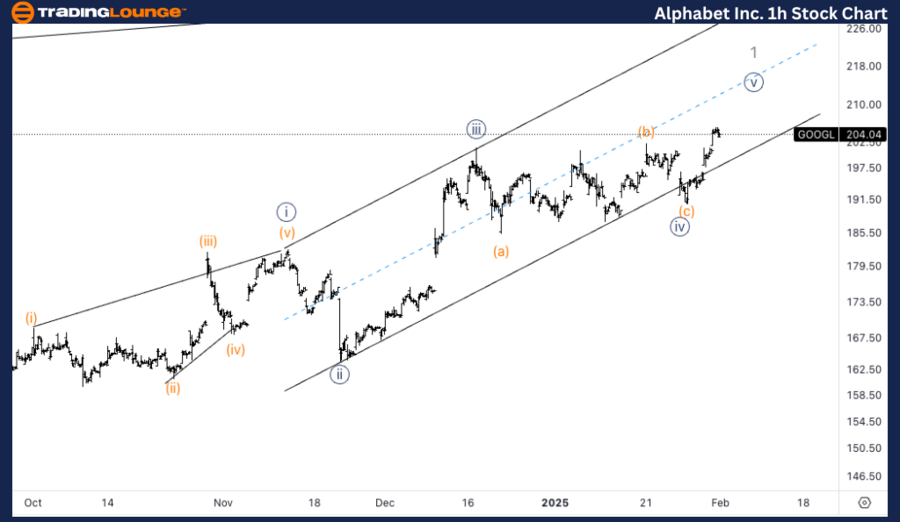
GOOGL Elliott Wave technical analysis – One-hour chart
We are anticipating further upside into wave {v}. The support provided by the parallel trend channel strengthens the overall bullish outlook for GOOGL. This indicates that the current structure could see completion with further gains before a potential pullback.
This Elliott Wave analysis for Alphabet Inc., (GOOGL) examines both the daily and 1-hour charts to assess its current market trend, utilizing Elliott Wave Theory to anticipate potential future movements.
Alphabet Inc.(GOOGL) Elliott Wave technical analysis [Video]
Author

Peter Mathers
TradingLounge
Peter Mathers started actively trading in 1982. He began his career at Hoei and Shoin, a Japanese futures trading company.


