Alphabet Inc. (GOOGL) Elliott Wave technical analysis [Video]
![Alphabet Inc. (GOOGL) Elliott Wave technical analysis [Video]](https://editorial.fxstreet.com/images/Markets/Equities/Industries/Software/software-code-637435356353853480_XtraLarge.jpg)
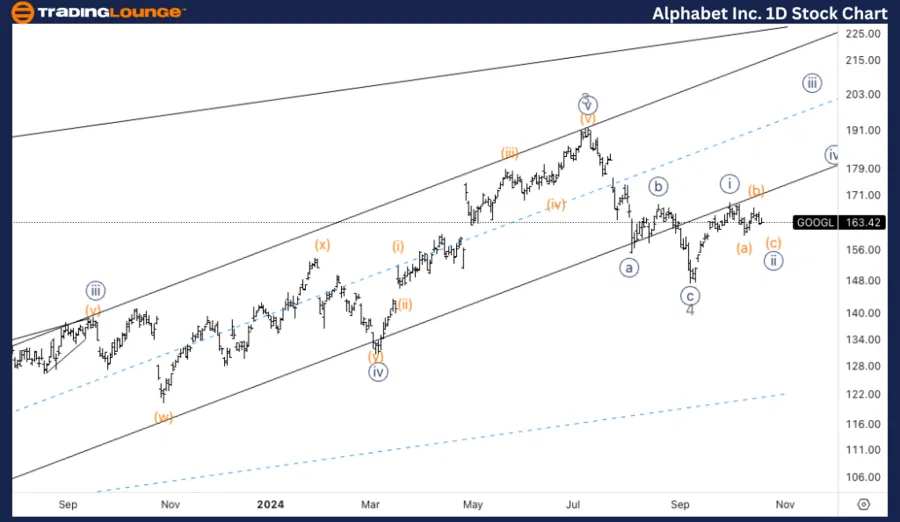
GOOGL Elliott Wave technical analysis
-
Function: Trend.
-
Mode: Impulsive.
-
Structure: Motive.
-
Position: Minor Wave 5.
-
Direction: Upside within Wave 5.
-
Details: A potential bottom in Wave 4 has formed, and we are now observing a {i}-{ii} of Wave 5.
GOOGL Elliott Wave technical analysis – Daily chart
On the daily chart, Alphabet (GOOGL) is in the early stages of Minor Wave 5, suggesting the resumption of an uptrend. The preceding Wave 4 correction seems to have bottomed, and the market is now building toward a new impulsive structure in Wave 5, likely unfolding in a {i}-{ii} formation. The overall outlook is for continued upside as this final wave progresses.
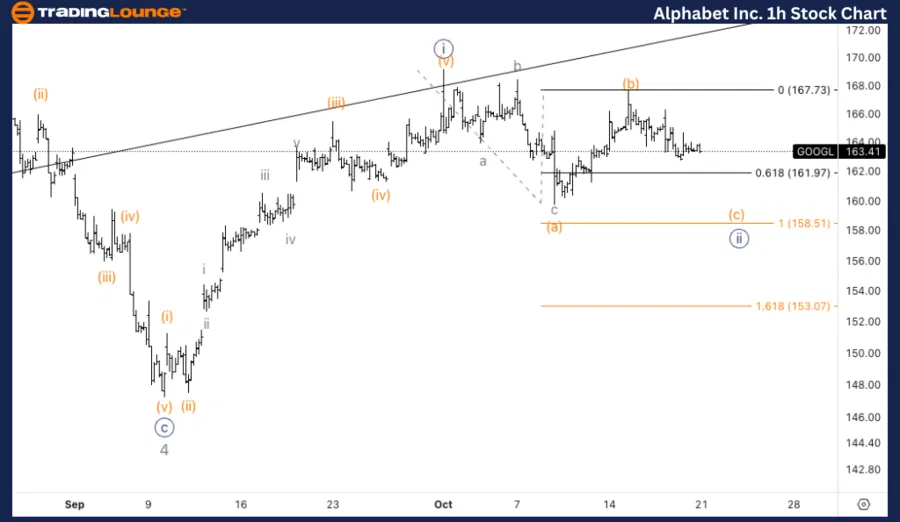
GOOGL Elliott Wave technical analysis
-
Function: Trend
-
Mode: Impulsive
-
Structure: Motive
-
Position: Wave {ii} of 5
-
Direction: Bottom in Wave {ii}
-
Details: Expecting one more leg lower into Wave (c), ideally towards equality with Wave (a), before turning higher within Wave {iii}.
GOOGL Elliott Wave technical analysis – One-hour chart
On the 1-hour chart, GOOGL is currently in Wave {ii} of 5, with a potential further downside move expected. The market appears to be near the completion of the corrective structure in Wave {ii}, particularly in Wave (c), which targets equality with Wave (a). After this final leg lower, a reversal is anticipated, leading to the beginning of Wave {iii}, signaling the next phase of the uptrend.
This Elliott Wave analysis for Alphabet Inc. (GOOGL) covers both the daily and 1-hour charts, applying Elliott Wave Theory to evaluate potential future market movements.
Alphabet Inc. (GOOGL) Elliott Wave technical analysis [Video]
Author

Peter Mathers
TradingLounge
Peter Mathers started actively trading in 1982. He began his career at Hoei and Shoin, a Japanese futures trading company.


