Alphabet Inc. (GOOGL) Elliott Wave technical analysis [Video]
![Alphabet Inc. (GOOGL) Elliott Wave technical analysis [Video]](https://editorial.fxstreet.com/images/MoneyManagement/Leverage/computer-access-gm121044031-2180119_XtraLarge.jpg)
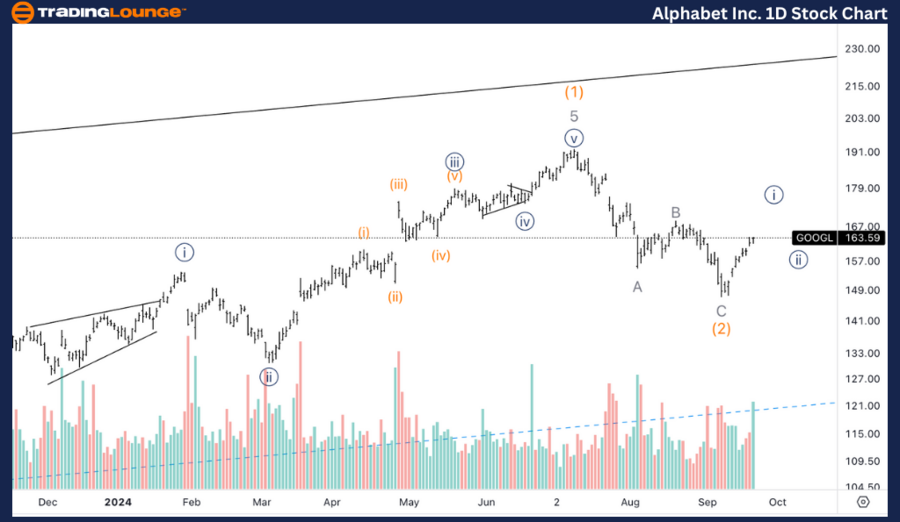
GOOGL Elliott Wave Analysis Trading Lounge Daily Chart,
Alphabet Inc., (GOOGL) Daily Chart.
GOOGL Elliott Wave technical analysis
Function: Trend.
Mode: Impulsive.
Structure: Motive.
Position: Minor wave 1.
Direction: Subdivision in wave 1.
Details: As volume increases on the move up we can expect to have a bottom in place in wave (2). The next target will be Minor Group2 starting at 165$.
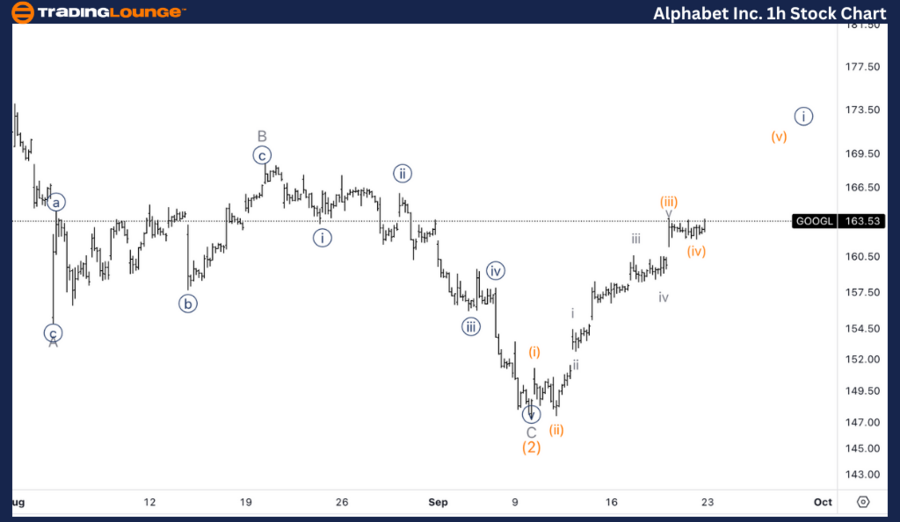
GOOGL Elliott Wave Analysis Trading Lounge 1H Chart,
Alphabet Inc., (GOOGL) 1H Chart.
GOOGL Elliott Wave technical analysis
Function: Trend.
Mode: Impulsive.
Structure: Motive.
Position: Minute wave {i}.
Direction: Upside in wave {i}.
Details: Looking for what appears to be a clear five wave move off the lows, which would peak where the previous wave B top stands.
In this analysis of Alphabet Inc. (GOOGL), we will use Elliott Wave Theory to evaluate the stock's current price movement, highlighting potential trading opportunities. By examining both the daily and 1-hour charts, we aim to provide a clear outlook of GOOGL's market behavior.
GOOGL Elliott Wave technical analysis – Daily chart
On the daily chart, Alphabet is progressing through an impulsive mode in Minor Wave 1 of a larger bullish structure. Recent price action indicates a potential bottom is in place for Wave (2), supported by increasing volume on the upward move, suggesting renewed buying interest.
The next key target to watch is MinorGroup2, starting at $165, which may act as a resistance zone or psychological barrier. If the stock continues to build momentum within Wave 1, a break above this level would signal further upside in the overall bullish trend.
GOOGL Elliott Wave technical analysis – One-hour chart
On the 1-hour chart, GOOGL is advancing within Minute Wave {i}, which appears to be forming a clear five-wave structure from recent lows. This development confirms the start of an impulsive move from the previous bottom. The target for this wave is likely around the previous Wave B top, which serves as an important resistance level.
If the current five-wave move completes as expected, this would confirm the bullish trend continuation, with the potential for higher highs in the upcoming waves.
Technical analyst: Alessio Barretta.
GOOGL Elliott Wave technical analysis [Video]
Author

Peter Mathers
TradingLounge
Peter Mathers started actively trading in 1982. He began his career at Hoei and Shoin, a Japanese futures trading company.