Alphabet Inc. (GOOGL) Elliott Wave technical analysis [Video]
![Alphabet Inc. (GOOGL) Elliott Wave technical analysis [Video]](https://editorial.fxstreet.com/images/Markets/Equities/Industries/Software/software-code-637435356353853480_XtraLarge.jpg)
GOOGL Elliott Wave technical analysis
Function: Trend.
Mode: Impulsive.
Structure: Motive.
Position: Minor 3.
Direction: Upside in Minor 3.
Details: Looking for a series of wave threes to unfold, which signifies more upside to come in the future.
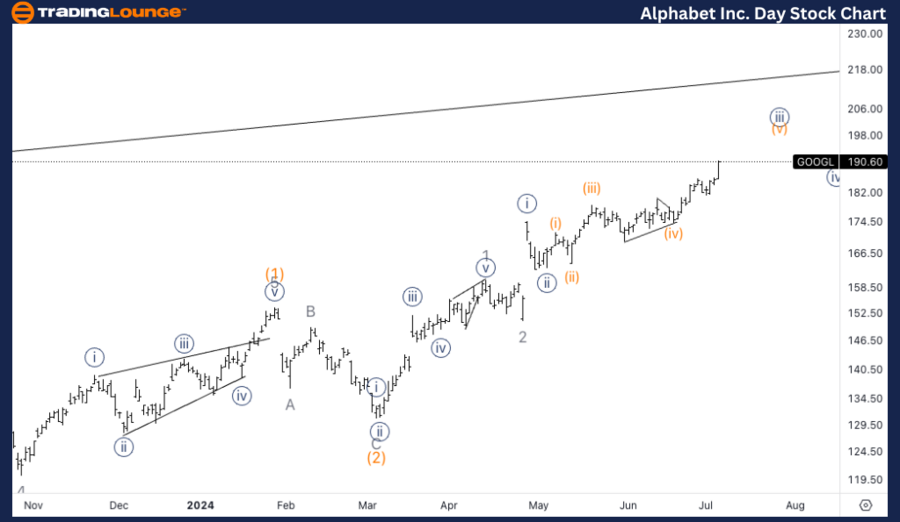
GOOGL Elliott Wave technical analysis – Daily chart
The daily chart indicates that GOOGL is in the midst of Minor wave 3, suggesting that a series of wave threes are likely to unfold, signaling continued upside potential. This wave 3 is typically associated with strong bullish movement, often the most powerful wave in the sequence. Traders should look for higher highs and follow the bullish trend until a clear signal of wave 4 emerges.
GOOGL Elliott Wave technical analysis
Function: Trend
Mode: Impulsive
Structure: Motive
Position: Wave (v) of {iii}
Direction: Upside in wave (v).
Details: Looking for upside into wave (v) as have reached equality of {iii} vs. {i} and we are now targeting 1.618.
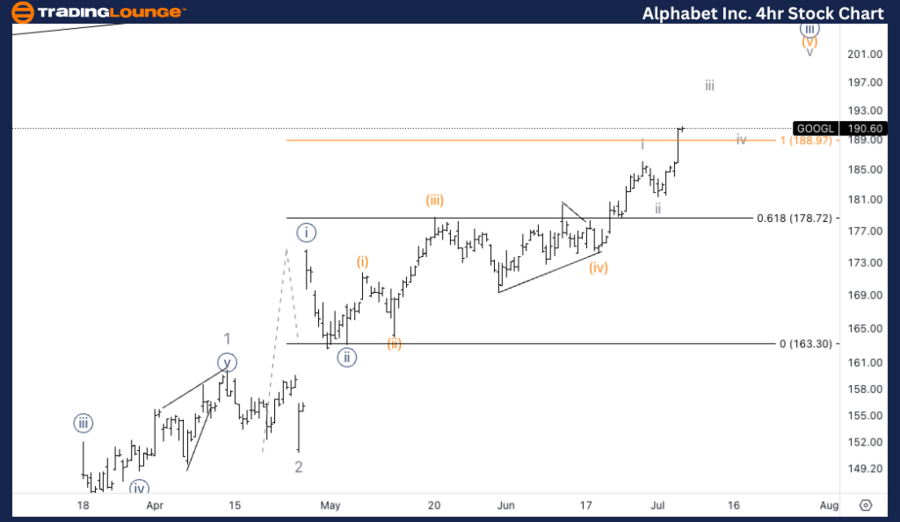
GOOGL Elliott Wave technical analysis – Four-hour chart
The 4-hour chart shows that GOOGL is advancing into wave (v) of {iii}. This wave is currently targeting the 1.618 extension level after having reached equality of {iii} vs.
Welcome to our latest Elliott Wave analysis for Alphabet Inc. (GOOGL). This analysis provides a detailed overview of GOOGL's price movements using the Elliott Wave Theory, aimed at helping traders identify potential trading opportunities based on current trends and market structure. We will cover insights from both the daily and 4-hour charts to offer a comprehensive perspective on Alphabet Inc.'s market behavior.
Alphabet Inc. (GOOGL) Elliott Wave technical analysis [Video]
Author

Peter Mathers
TradingLounge
Peter Mathers started actively trading in 1982. He began his career at Hoei and Shoin, a Japanese futures trading company.


