Alibaba Stock Forecast: BABA stock breaks below $130 in premarket


  • BABA stock is trading at four-year low.
  • Goldman Sachs removed it from its Conviction Buy List.
  • The RSI shows an oversold reading for Alibaba shares.

Things are not going well for Alibaba (BABA) shares. The stock dropped below the critical $130 level in Tuesday's premarket as institutional investors continue to give up on yesteryear's Chinese wunderkind. BABA shares are now trading at a four-year low.

Alibaba (BABA) Stock News: Goldman downgrades its golden boy

Famously, Goldman Sachs bought about one-third of Alibaba back in 1999 when it was a lowly startup. In 2004 it sold the stake for $22 million, which amounted to nearly a seven-bagger. Of course if it had held the shares until today, even after Alibaba stock has dropped 60% from its all-time high last year, that stake would amount to $117 billion or about 92% of Goldman Sachs' current market cap.

On Monday, Goldman analysts removed BABA from its Conviction Buy List. The stock has underperformed massively in 2021 due to Chinese govenment scrutiny, as well as the Chinese Communist Party strong-arming the ecommerce giant into spending an additional $15.5 billion on political initiatives. Goldman cut its price target from $252 to $215 – still meaning the investment bank sees 65% upside in the BABA price.

The recent quarter's earnings also left the market wanting. The revenue estimates were revised down from about 29.5% YoY growth to between 20% and 23%.

Out of 52 analysts covering Alibaba, 36 have cut their stock price targets since Alibaba reported their Q3 earnings report, according to FactSet, but 47 of those analysts expect a bullish outlook.

BABA key statistics

Market Cap $359 billion
Price/Earnings 19
Price/Sales 3
Price/Book 2
Enterprise Value $311 billion
Operating Margin 13%
Profit Margin

15%

52-week high $319.32
52-week low $130.55
Short Interest 2%
Average Wall Street Rating and Price Target Buy 212.41

Alibaba (BABA) Forecast: Relying on 2018 for support

Since BABA stock broke through the $140 support level on November 18 due to lacklustre earnings, the stock gently descended over the following week in what looked like support at $130. Since some sales happened in the high $129s in Tuesday's premarket, all bets are off.

This area also acted as support in October and December 2018. This means the support may yet hold up. If not, there is no sold ground below $130 until $109, an area that acted as resistance all the way back in September and October of 2016.

That we are searching for support five years ago says all that needs to be said about BABA's weakness. The Relative Strength Index (RSI) sits at 32 on the weekly chart below, just above oversold. The Moving Average Convergence Divergence (MACD) has once again crossed lower after giving a positive reading in October. It seems BABA wishes to close out the year as it began – under a cloud of doom.
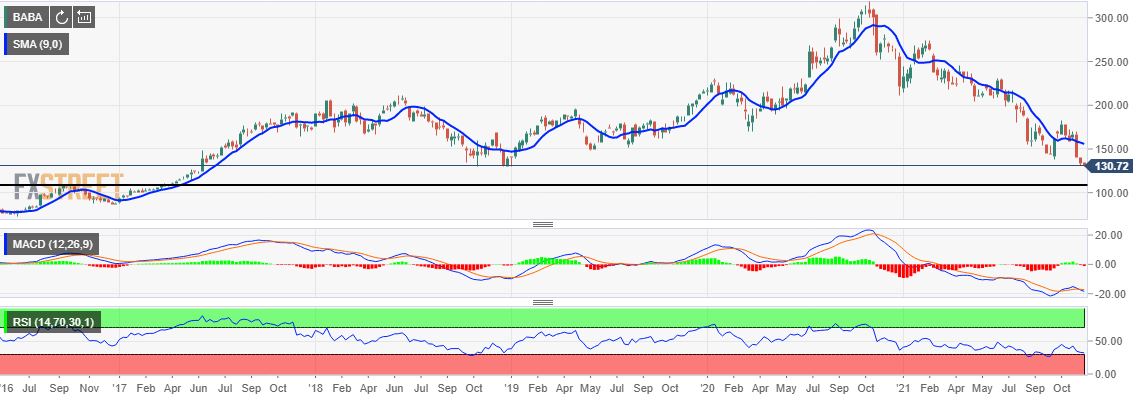
BABA 1-week chart

Share: Feed news

Information on these pages contains forward-looking statements that involve risks and uncertainties. Markets and instruments profiled on this page are for informational purposes only and should not in any way come across as a recommendation to buy or sell in these assets. You should do your own thorough research before making any investment decisions. FXStreet does not in any way guarantee that this information is free from mistakes, errors, or material misstatements. It also does not guarantee that this information is of a timely nature. Investing in Open Markets involves a great deal of risk, including the loss of all or a portion of your investment, as well as emotional distress. All risks, losses and costs associated with investing, including total loss of principal, are your responsibility. The views and opinions expressed in this article are those of the authors and do not necessarily reflect the official policy or position of FXStreet nor its advertisers. The author will not be held responsible for information that is found at the end of links posted on this page.

If not otherwise explicitly mentioned in the body of the article, at the time of writing, the author has no position in any stock mentioned in this article and no business relationship with any company mentioned. The author has not received compensation for writing this article, other than from FXStreet.

FXStreet and the author do not provide personalized recommendations. The author makes no representations as to the accuracy, completeness, or suitability of this information. FXStreet and the author will not be liable for any errors, omissions or any losses, injuries or damages arising from this information and its display or use. Errors and omissions excepted.

The author and FXStreet are not registered investment advisors and nothing in this article is intended to be investment advice.

Recommended content


Recommended content

Editors’ Picks

EUR/USD retreats to 1.0700 area following post-PCE jump

EUR/USD retreats to 1.0700 area following post-PCE jump

After spiking to a daily high of 1.0720 with the immediate reaction to US PCE inflation data, EUR/USD lost its traction and declined to the 1.0700 area. Investors remain cautious ahead of this weekend's French election and make it difficult for the Euro to gather strength.

EUR/USD News

GBP/USD stays below 1.2650 after US inflation data

GBP/USD stays below 1.2650 after US inflation data

GBP/USD struggles to preserve its bullish momentum and trades below 1.2650 in the American session on Friday. Earlier in the day, the data from the US showed that the annual core PCE inflation declined to 2.6% in May, limiting the USD's upside and helping the pair hold its ground.

GBP/USD News

Gold keeps its daily gains near $2,330 following US PCE data

Gold keeps its daily gains near $2,330 following US PCE data

Gold prices maintain their constructive bias around $2,330 after US inflation readings gauged by the PCE matched consensus in May and US yields advance slightly across the curve.

Gold News

BTC struggles around the $62,000 level

BTC struggles around the $62,000 level

Bitcoin price faces pullback resistance at the lower band of the descending wedge around $62,000. Ethereum price finds support at $3,288, the 61.8% Fibonacci retracement level. Ripple price faces resistance at $0.500, its daily resistance level.

Read more

French Elections Preview: Euro to suffer after the calm, as specter of extremists, uncertainty rise Premium

French Elections Preview: Euro to suffer after the calm, as specter of extremists, uncertainty rise

The first round of French parliamentary elections is set to trigger high uncertainty. Soothing messages from the far right and far left leave the Euro vulnerable to falls. Calm may return only after the second round of voting on  July 7.

Read more

Forex MAJORS

Cryptocurrencies

Signatures