Alibaba Stock Forecast: BABA shares stubbornly hold onto $90s
- BABA shares regain 1% after losing 2.8% on Wednesday.
- Alibaba reported EPS of $1.55 on $32.2 billion in revenue on May 26.
- BABA stock is trading within a symmetrical wedge and needs to conquer $103.

Alibaba (BABA) stock is not interested in giving up the $90 level anytime soon. Shares of BABA are up 1% to $94.30 in Thursday's premarket. Alibaba's share price spiked more than 15% on Thursday, May 26, after the company reported earnings that trounced analyst expectations despite China's covid lockdowns. The company reported EPS of $1.55 on revenue of $32.2 billion for the quarter ending March 31. Wall Street had expected EPS of $1.07 on $29.9 billion.
Also read: Apple Stock Deep Dive: AAPL price target at $100 on falling 2023 revenues
Enough enthusiasm has not presented itself to push BABA stock back above the all-important $100 psychological level, however. Despite Beijing claiming that its internet firm crackdown is over, investors have had their government obstruction fears replaced by economic worries. The most recent data out of China relayed a drastic pullback in almost every category due to China's lockdowns. Industrial output dropped more than 11% in April. Research firm Prequin said that in the January through April period Chinese-focused private equity and ventural capital firms have raised just 10% of what they raised in the first four months of 2021. The Chinese real estate sector has been so moribund that the government suddenly announced the opening of its bond market to foreign investors last week.
Alibaba Forecast: A symmetrical wedge holds bulls in place
Alibaba stock has been trading within a symmetrical wedge structure since at least March 15. This wedge has offered up higher lows and lower highs with an apex around $88.50. For traders, this means that it is a good time to sell if BABA shares break below $88.50 and vice-versa.
One good sign for bulls is that the 9-day moving average has just broken above the 20-day moving average. This represents the near-term optimism in the e-commerce mega-cap's stock price. The crosspoint at $89.30 may provide some support as well. BABA has remained above $90 for four straight sessions, but this week it has closed lower than its open in both sessions. BABA needs to complete a higher close this week to retain a positive sentiment and have a hope of retaining the $90 level going into next week.
Another good sign is the Moving Average Convergence Divergence (MACD), which has shown the MACD line growing its distance above the signal line. If they can maintain this trajectory above the zero bound, then a true rally makes be in the works. Of course, the main thing to look for is whether BABA can sustain a close either above or below the wedge trend lines. At the moment these are at $103 and $82. A break of either trend line should result in a large move in that direction.
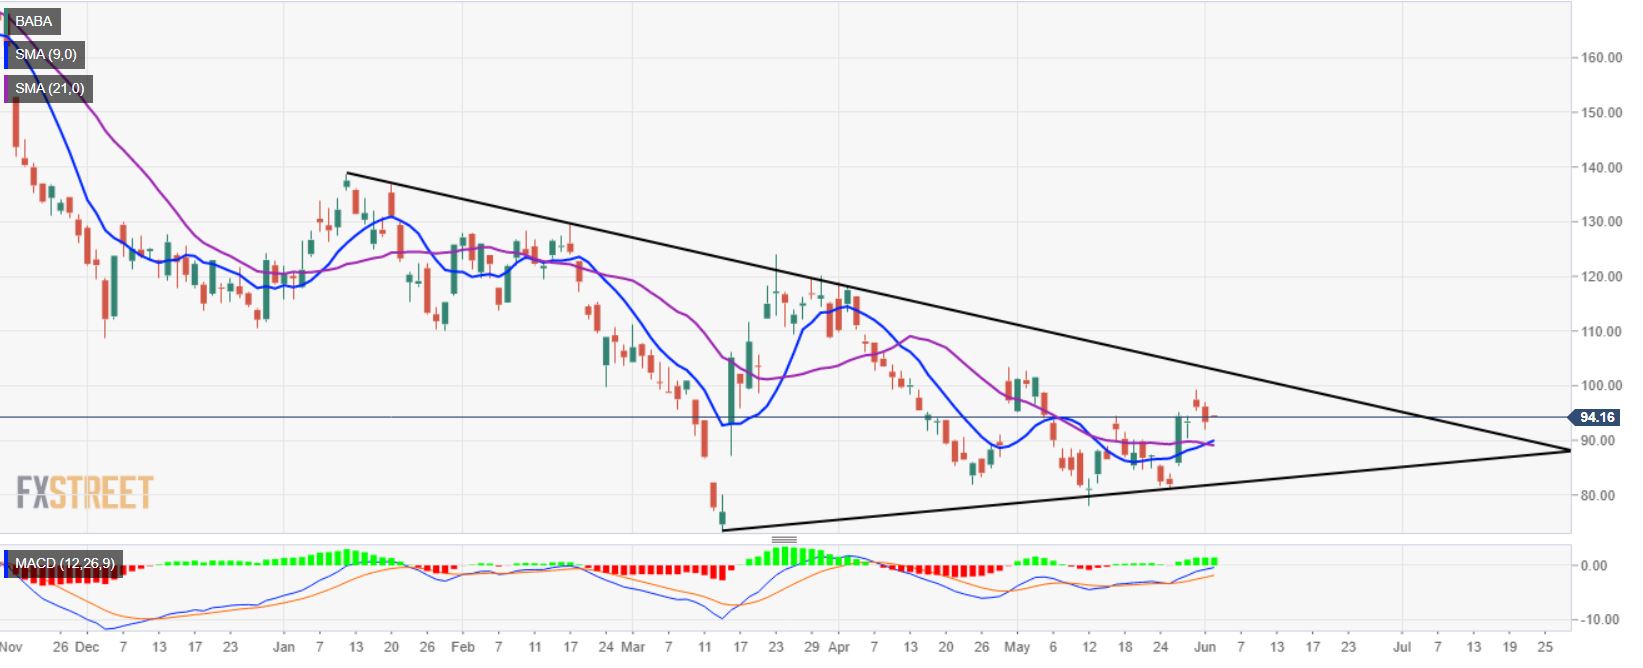
BABA daily chart
Like this article? Help us with some feedback by answering this survey:
Premium
You have reached your limit of 3 free articles for this month.
Start your subscription and get access to all our original articles.
Author

Clay Webster
FXStreet
Clay Webster grew up in the US outside Buffalo, New York and Lancaster, Pennsylvania. He began investing after college following the 2008 financial crisis.


