|

Alibaba ($BABA) perfect reaction lower from blue box area

In today’s article, we will look at the past performance of 1 Hour Elliottwave chart of Alibaba ($BABA). The decline from 06.09.2022 high is unfolding as a 5 swings and made a lower low on 09.16.2022 which created a bearish sequence in the 4H timeframe. Therefore, we knew that the structure in $BABA is incomplete to the downside & should see more weakness. So, we advised members to sell the bounces in 3, 7, or 11 swings at the blue box area. We will explain the structure & forecast below:

$BABA 1H Elliott Wave chart 10.04.2022

Chart

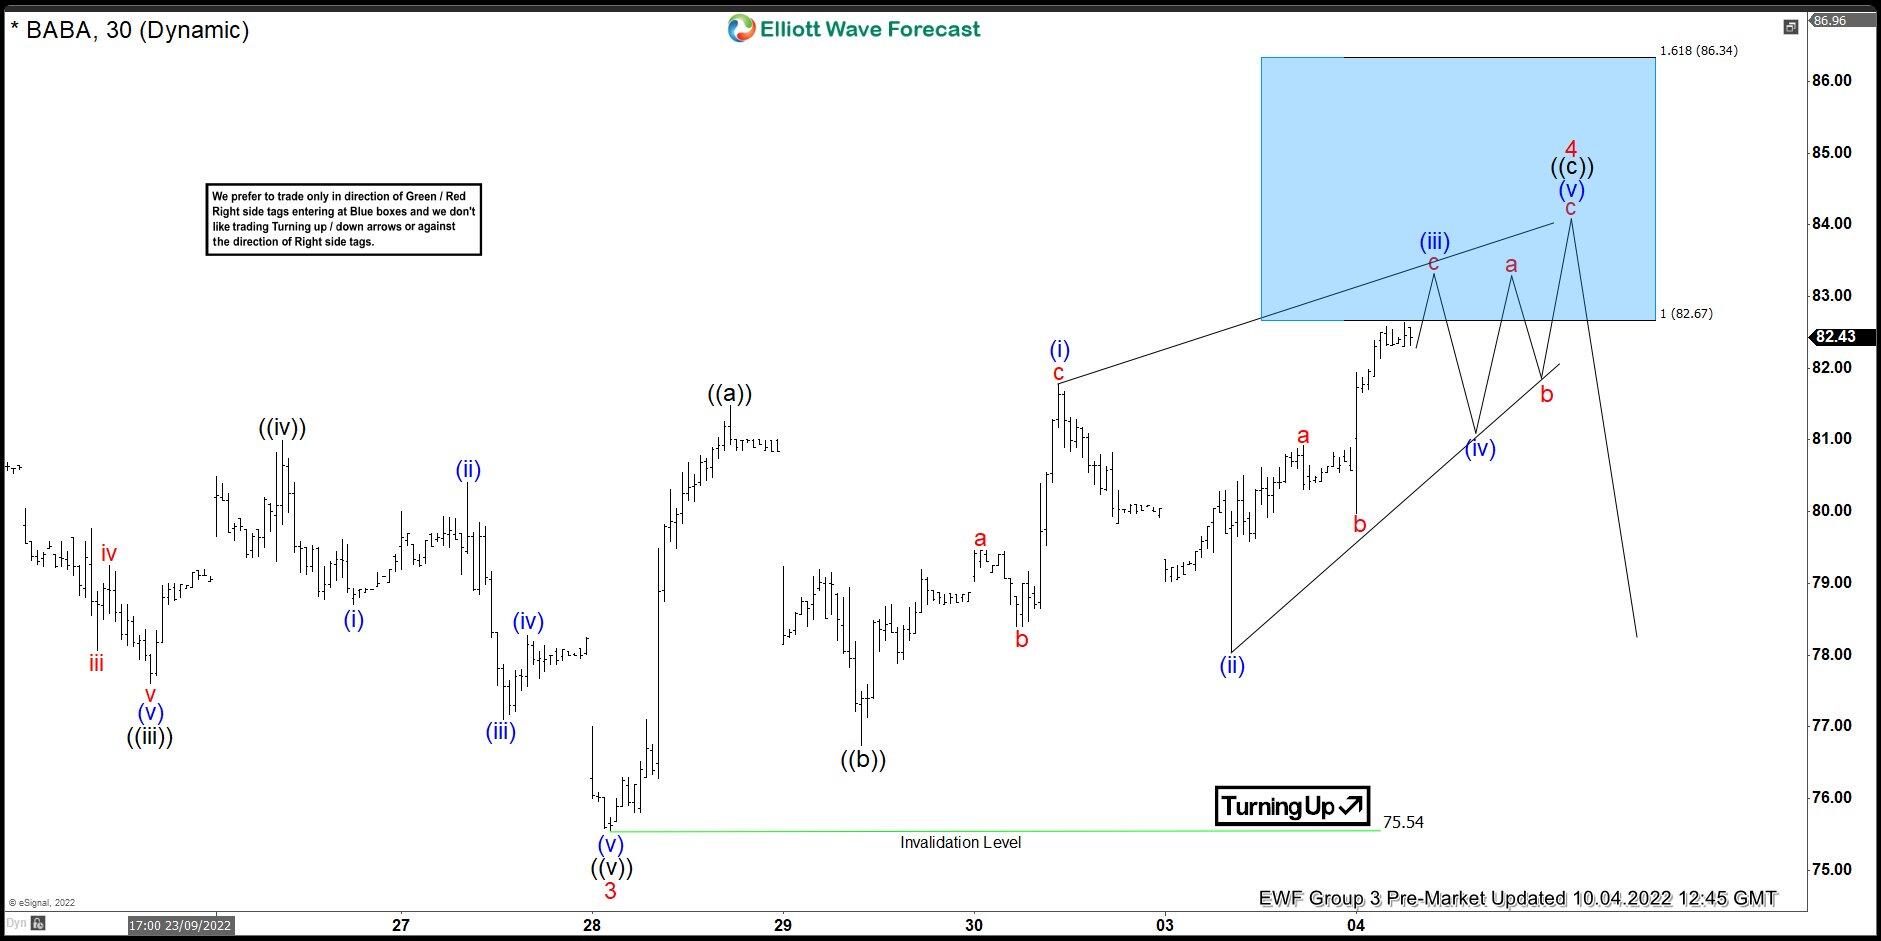
Here is the 1H Elliottwave count from 10.04.2022. The decline from 09.12.2022 unfolded in 5 waves creating a bearish sequence. We were calling for the bounce to fail in 3 swings at red 4 where we like to sell it at the equal legs at $82.67 with a stop at $86.34.

$BABA latest Elliott Wave chart

Chart

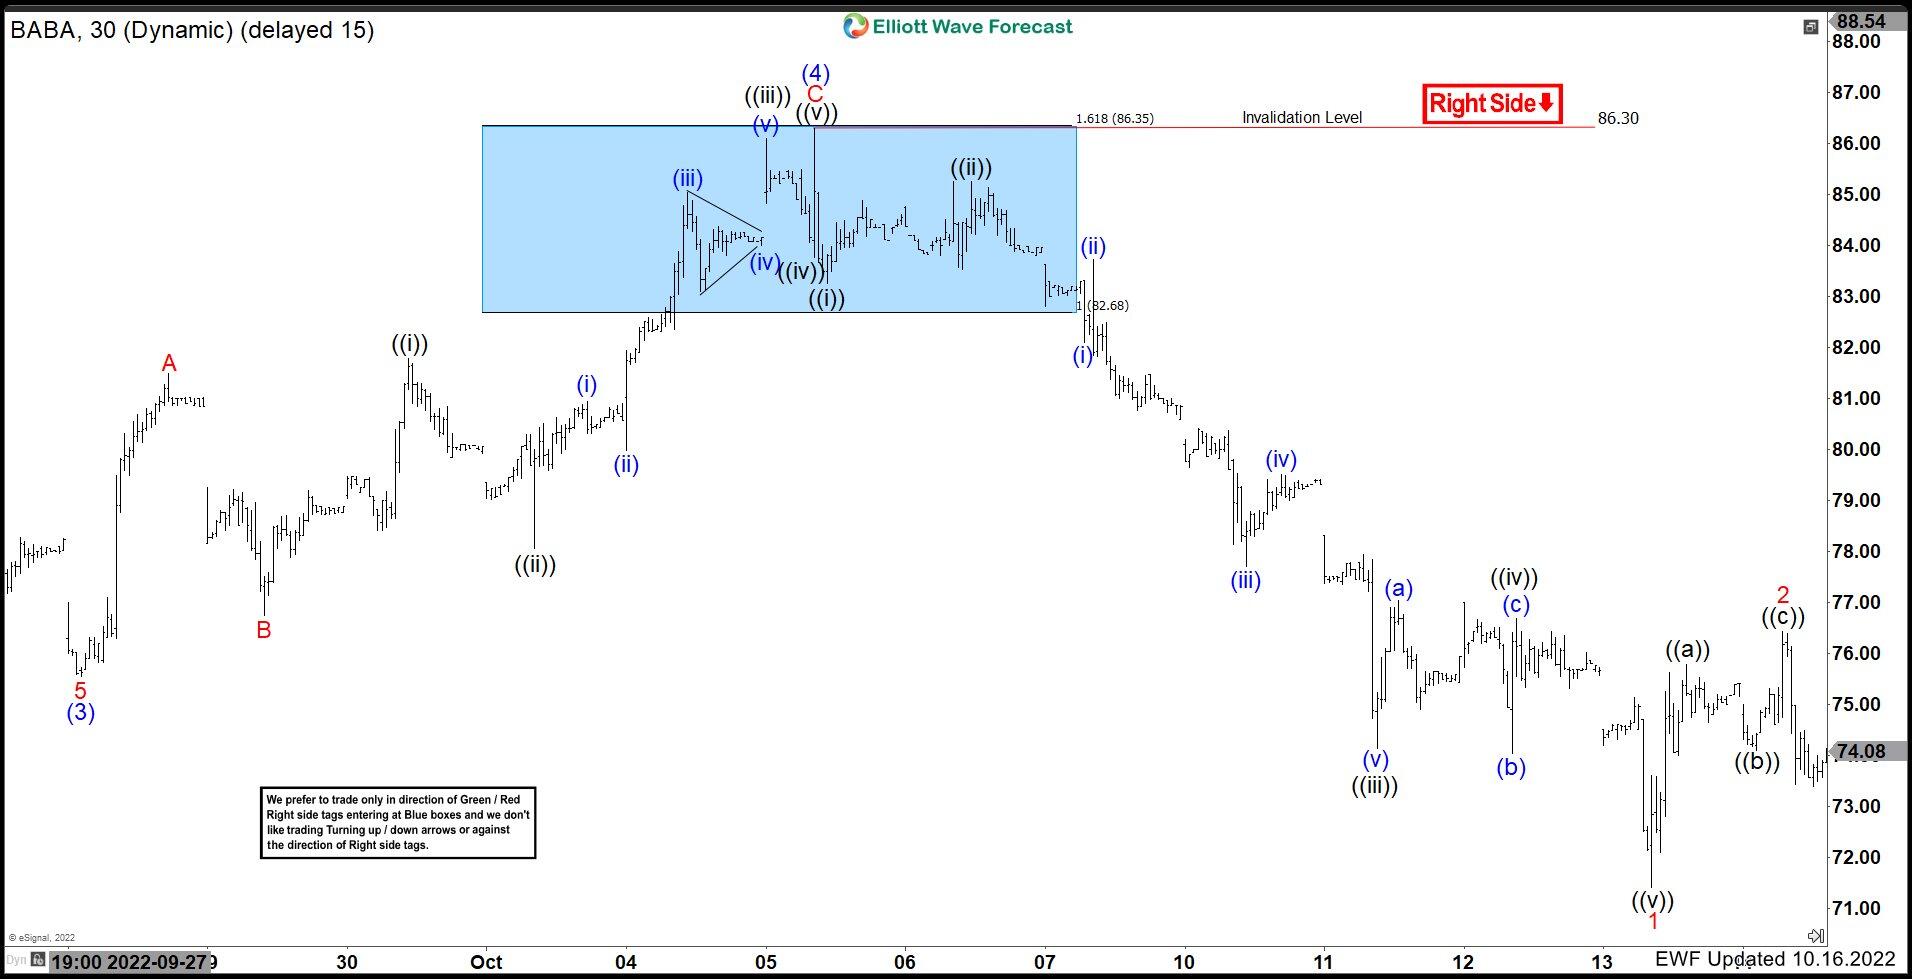
Here is the 10.16.2022 1H update showing the move taking place as expected. The stock has reacted lower from the blue box allowing any shorts to get risk free shortly after taking the position. Currently, the stock has already made a new low in 5 swings and shorts should be out with profits before a bounce can take place in 3 swings at least.

Author

Elliott Wave Forecast Team

Elliott Wave Forecast Team

ElliottWave-Forecast.com

More from Elliott Wave Forecast Team
Share:

Editor's Picks

EUR/USD flirts with daily highs, retargets 1.1900

EUR/USD regains upside traction, returning to the 1.1880 zone and refocusing its attention to the key 1.1900 barrier. The pair’s slight gains comes against the backdrop of a humble decline in the US Dollar as investors continue to assess the latest US CPI readings and the potential Fed’s rate path.

GBP/USD remains well bid around 1.3650

GBP/USD maintains its upside momentum in place, hovering around daily highs near 1.3650 and setting aside part of the recent three-day drop. Cable’s improved sentiment comes on the back of the Greenback’s  irresolute price action, while recent hawkish comments from the BoE’s Pill also collaborate with the uptick.

Gold clings to gains just above $5,000/oz

Gold is reclaiming part of the ground lost on Wednesday’s marked decline, as bargain-hunters keep piling up and lifting prices past the key $5,000 per troy ounce. The precious metal’s move higher is also underpinned by the slight pullback in the US Dollar and declining US Treasury yields across the curve.

Crypto Today: Bitcoin, Ethereum, XRP in choppy price action, weighed down by falling institutional interest 

Bitcoin's upside remains largely constrained amid weak technicals and declining institutional interest. Ethereum trades sideways above $1,900 support with the upside capped below $2,000 amid ETF outflows.

Week ahead – Data blitz, Fed Minutes and RBNZ decision in the spotlight

US GDP and PCE inflation are main highlights, plus the Fed minutes. UK and Japan have busy calendars too with focus on CPI. Flash PMIs for February will also be doing the rounds. RBNZ meets, is unlikely to follow RBA’s hawkish path.

Ripple Price Forecast: XRP potential bottom could be in sight

Ripple edges up above the intraday low of $1.35 at the time of writing on Friday amid mixed price actions across the crypto market. The remittance token failed to hold support at $1.40 the previous day, reflecting risk-off sentiment amid a decline in retail and institutional sentiment.