- AMD rose 1.6% on Thursday.
- Advanced Micro Devices increased its wafer supply deal with GlobalFoundries.
- Thursday's AMD price surged above the 21-day moving average.
Advanced Micro Devices (AMD) stock rose 1.6% on Thursday and broke a prior swing high with a session high of $149. Though the end of the session pushed the price down below $147, AMD price surmounted the 21-day moving average for the first time since December 3. This is a sign that this rally could continue through the new year.
Advanced Micro Devices Stock News: AMD adds $500 million to silicon wafer deal with GlobalFoundries
Advanced Micro Devices amended a regulatory filing on Thursday. The chip maker has expanded the value of its $1.6 billion deal with former subsidiary GlobalFoundries that was announced in May. The prior deal dealt with silicon wafer supply through 2024. The new deal calls for increasing the deal to $2.1 billion worth of silicon wafers from 2022 to 2025. GlobalFoundries is the product of AMD spinning out its foundry operations in 2009.
President and CEO Lisa Su will host AMD's 2022 Product Premiere on Tuesday, January 4, 2022. Su will show off innovations in AMD's new Ryzen processors and Radeon graphics cards.
AMD key statistics
Market Cap | $167 billion |
Price/Earnings | 43 |
Price/Sales | 11 |
Price/Book | 23 |
Enterprise Value | $164 billion |
Operating Margin | 21% |
Profit Margin |
27% |
52-week high | $164.46 |
52-week low | $72.50 |
Short Interest | 6% |
Average Wall Street Rating and Price Target | Buy, $142.50 |
Advanced Micro Devices Stock Forecast:
Thursday's 1.6% move pushed AMD shares above the 21-day moving average. While that average is still above its 9-day counterpart, other signs give the impression that the rally is ready to continue.
For one, the Moving Average Convergence Divergence (MACD) indicator appears likely to cross over in the coming sessions as it has narrowed its distance with the signal line.
Though Thursday faced resistance around $147 and $148, this has been seen before on December 7, 8, 9, 15 and 16. Still the high at $149 demonstrates that the market expects this one to aim for $150 and maybe even $160 soon enough.
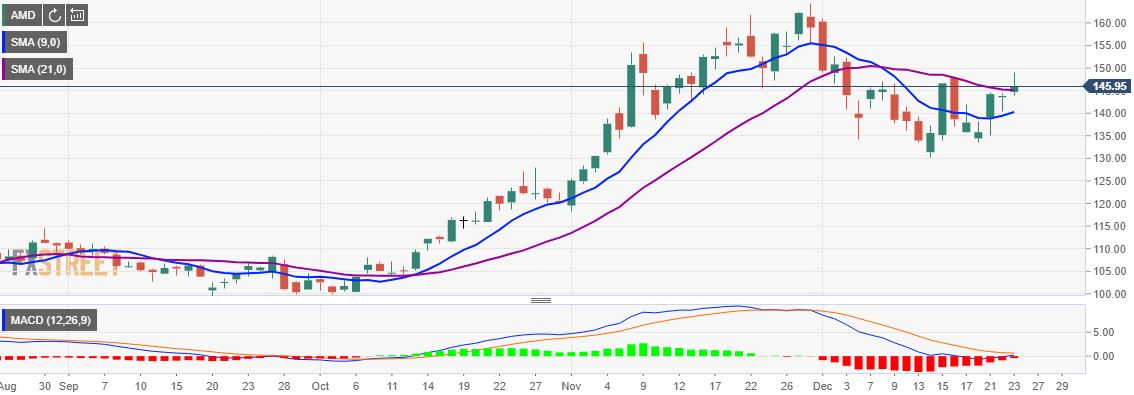
AMD 1-day chart
Like this article? Help us with some feedback by answering this survey:
Information on these pages contains forward-looking statements that involve risks and uncertainties. Markets and instruments profiled on this page are for informational purposes only and should not in any way come across as a recommendation to buy or sell in these assets. You should do your own thorough research before making any investment decisions. FXStreet does not in any way guarantee that this information is free from mistakes, errors, or material misstatements. It also does not guarantee that this information is of a timely nature. Investing in Open Markets involves a great deal of risk, including the loss of all or a portion of your investment, as well as emotional distress. All risks, losses and costs associated with investing, including total loss of principal, are your responsibility. The views and opinions expressed in this article are those of the authors and do not necessarily reflect the official policy or position of FXStreet nor its advertisers. The author will not be held responsible for information that is found at the end of links posted on this page.
If not otherwise explicitly mentioned in the body of the article, at the time of writing, the author has no position in any stock mentioned in this article and no business relationship with any company mentioned. The author has not received compensation for writing this article, other than from FXStreet.
FXStreet and the author do not provide personalized recommendations. The author makes no representations as to the accuracy, completeness, or suitability of this information. FXStreet and the author will not be liable for any errors, omissions or any losses, injuries or damages arising from this information and its display or use. Errors and omissions excepted.
The author and FXStreet are not registered investment advisors and nothing in this article is intended to be investment advice.
Recommended content
Editors’ Picks
AUD/USD corrects toward 0.6850, awaits US PCE Price Index
AUD/USD is falling back toward 0.6850 in Friday's Asian trading, reversing from near 19-month peak. A tepid US Dollar bounce drags the pair lower but the downside appears called by the latest Chinese stimulus measures, which boost risk sentiment ahead of US PCE data.
USD/JPY rebounds toward 146.00, as focus shifts to US PCE data
USD/JPY is bouncing back toward 146.00 in the Asian session on Friday even as Tokyo CPI inflation data keep hopes of BoJ rate hikes alive. Intensifying risk flows on China's policy optimism underpin the pair's renewed upside. The focus shifts to the US PCE inflation data.
Gold price consolidates below record high as traders await US PCE Price Index
Gold price climbed to a fresh all-time peak on Thursday amid dovish Fed expectations. The USD languished near the YTD low and shrugged off Thursday’s upbeat US data. The upbeat market mood caps the XAU/USD ahead of the key US PCE Price Index.
Bitcoin surges past $65,000, sets sights on $70,000
Bitcoin broke above its consolidation zone, signaling a potential bullish move ahead. At the same time, Ethereum is finding support at a key level, hinting at an upcoming rally. In contrast, Ripple consolidates between its crucial levels, indicating a period of indecision among traders.
RBA widely expected to keep key interest rate unchanged amid persisting price pressures
The Reserve Bank of Australia is likely to continue bucking the trend adopted by major central banks of the dovish policy pivot, opting to maintain the policy for the seventh consecutive meeting on Tuesday.
Five best Forex brokers in 2024
VERIFIED Choosing the best Forex broker in 2024 requires careful consideration of certain essential factors. With the wide array of options available, it is crucial to find a broker that aligns with your trading style, experience level, and financial goals.