Advanced Micro Devices Stock Forecast: AMD sinks 8.3% as Fed officials downplay interest rate cuts
- Three separate Fed members said further evidence was needed before rate cuts.
- Fed speaker hawkishness sends all three stock indices lower.
- AMD slumps more than 8% on the change in sentiment.
- Industry group says chip sales rose 16% YoY in February.

Advanced Micro Devices (AMD) stock slid 8.26% on Thursday after tech stocks sold off on hawkish statements by Federal Reserve (Fed) officials. The NASDAQ reversed course from a gain above 1% earlier in the session to a loss of 1.4%. The Dow Jones and S&P 500 did slightly better, falling 1.35% and 1.23%, respectively.
AMD stock closed near its daily low at $165.83, a price level the market hasn’t experienced since February 20. The slumping price action came despite industry data showing that semiconductor sales were much higher in February than a year prior.
AMD continued trading lower afterhours, and Nvidia (NVDA) and Super Micro Computer (SMCI) shed 3.44% and 5.67%, respectively, in Wednesday's session.
AMD stock news
AMD’s rocky outing on Thursday began a steeper drop after Minneapolis Fed President Neel Kashkari said in an online Q&A session that the central bank might postpone cuts if inflation stalled out at its current level.
Cleveland Fed President Loretta Mester then echoed this sentiment when she said during an event that central bankers like here needed further evidence before triggering any cut to the fed funds rate. Until now, the general belief has been that the Fed would begin trimming rates at the June meeting.
Adding insult to injury, the usually dovish Austan Goolsbee, president of the Chicago Fed, said that Fed governors required more evidence that inflation was on its way toward its 2% mandate before they could agree to any cuts.
All indices slumped more than 1% due to the news. This is despite positive semiconductor industry news. The Semiconductor Industry Association reported that February sales rose 16% YoY globally while trending down 3% from January’s high.
Semiconductor stocks FAQs
A semiconductor is a term for various types of computer chips. Officially called semiconductor devices, these computer chips rely on semiconductor materials like silicon and gallium arsenide to process the electrical current that produces the modern world of computing. They come in many shapes, sizes, enhancements and configurations such as diodes, transistors and integrated circuits to more complicated applications like DRAM memory, simple processors and even GPUs.
First, there are the pure chip designers, such as Nvidia, AMD, Broadcom and Qualcomm. These companies use sophisticated software to design and test chips. Second, there are the equipment manufacturers that provide the machines necessary to build computer chips. These include ASML and Lam Research. Then, there are foundries that manufacture the chips. These include Taiwan Semiconductor and GlobalFoundries. Last of all are the integrated device manufacturers who design their own chips and additionally manufacture themselves. These include Samsung and Intel.
It is the observation that the number of transistors in an integrated circuit doubles every two years. The “law” is named after Gordon Moore, who founded Fairchild Semiconductor and later Intel. The doubling is possible due to the shrinking size of process nodes or parts in the computer chip. In 1971 the advanced commercial manufacturing had reached 10 microns in width. In 1987 semiconductor technology had advanced to 800 nanometers in width. By 1999, this process had moved to 180 nanometers. By 2007, the size had dropped to 32 nanometers, and this fell all the way to 3 nanometers in 2022, which is close to the size of human DNA.
In 2022, the global semiconductor industry had revenues just under $600 billion. In total, the industry shipped 1.15 trillion semiconductor units in 2021. The leading nations involved in the semiconductor supply chain are Taiwan, the United States, China, the Netherlands, South Korea, Japan and Israel.
AMD stock forecast
Luckily, AMD stockholders have support sitting nearby on the daily chart. AMD stock has not traded here since late February, but AMD is now nearing January/February support at $162.50. Below there is the resistance-turned-support level of $150, which was tested on several occasions in late December and early January.
The 20-day Simple Moving Average (SMA) is narrowing its lead over its 50-day counterpart, and a crossover there would bode poorly for AMD’s outlook. Additionally, the Moving Average Convergence Divergence (MACD) shows that AMD remains in a downtrend that is gaining steam as the indicator crosses below the zero threshold.
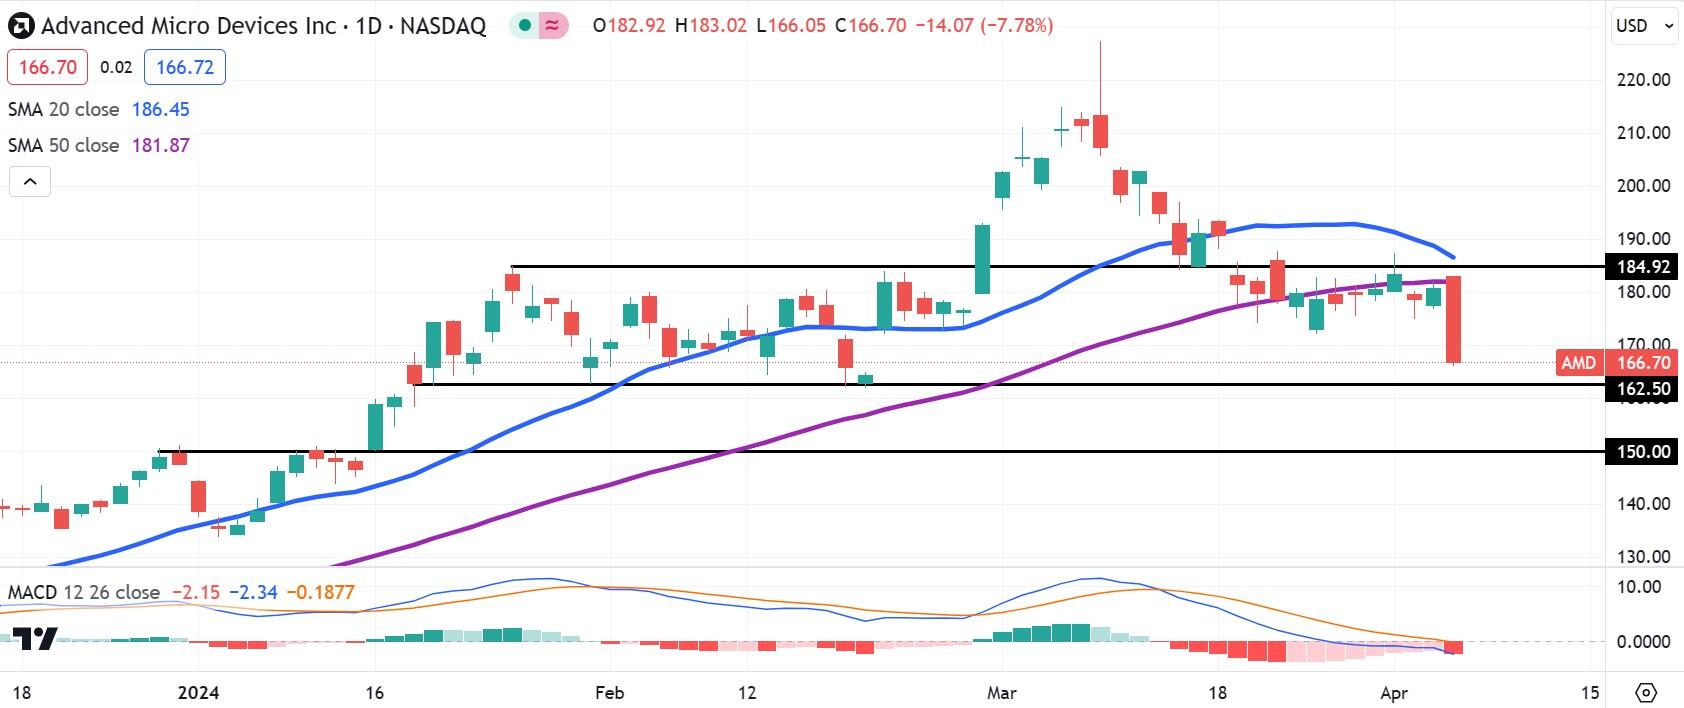
AMD daily stock chart
Premium
You have reached your limit of 3 free articles for this month.
Start your subscription and get access to all our original articles.
Author

Clay Webster
FXStreet
Clay Webster grew up in the US outside Buffalo, New York and Lancaster, Pennsylvania. He began investing after college following the 2008 financial crisis.


