Advanced Micro Devices Stock Forecast: AMD slumps over 8% to fresh yearly lows
- Advanced Micro Devices stock is at support in a wedge chart structure.
- The bottom of the wedge holds support at $86.18.
- $74 worked as strong support four times between Sept. 2020, May 2021.

Update: Advanced Micro Devices (AMD) stock snapped its previous day’s rebound and tumbled 8.12% on tumultuous Thursday, hitting fresh yearly lows at $80.65. Although the late rebound in the broader markets helped AMID share price to settle the day at $82.05. Major Wall Street indices sank of the return of recession fears, as global central banks remained committed to policy tightening in order to control inflation. The technology sector usually remains the hardest hit on central banks’ monetary policy normalization. Additionally, news that an Nvidia insider sold a significant amount of stock earlier this week continues to weigh negatively on the chipmaker.
Also read: Nvidia Stock Deep Dive Analysis: NVDA price target at $205 with strong revenue growth
AMD Stock News: Radeon RX 7000 GPU Series rumored for October
Although it is uncertain where the news stems from, multiple outlets are reporting on rumours that AMD's Radeon RX 7000 GPU Series will arrive as soon as late October or at the latest mid-November. This is a big deal as it may better help AMD begin to compete with the GPU king known as Nvidia (NVDA). The rumour has it that the graphics cards will be on store shelves soon after AMD ships the much-anticipated Zen 4-powered Ryzen 7000 CPUs.
Before the Fed had time to raise interest rates this week by 75 basis points, the most since 1994, AMD sold $1 billion worth of 10-year and 30-year senior unsecured notes last week. Half of the notes were sold at 3.924% and are due June 1, 2032, and the other half were sold at 4.393% and are due June 1, 2052. Getting this debt sale out the door now looks quite prescient as waiting even one week would have meant higher coupons.
AMD Stock Forecast: $74 is the next support level
Only last week did AMD rally up to the top of the symmetrical wedge structure it has been trading inside since April 26. That price level quickly gave way, and for the past week AMD has been riding the bottom support line of the wedge structure. At least it has held so far.
Yes, a sudden rally could send shares up to $100, but that seems unlikely. Though the Moving Average Convergence Divergence (MACD) rose above the zero threshold, it has since cross over and is now trending down. It sure looks set to break the lower bound of the wedge. If AMD stock pierces this support, which is now at $86.16, then shares will quickly trend down to $74. This support level has a lot going for it. It held up during four consecutive swing lows during the period between September 2020 and May 2021.
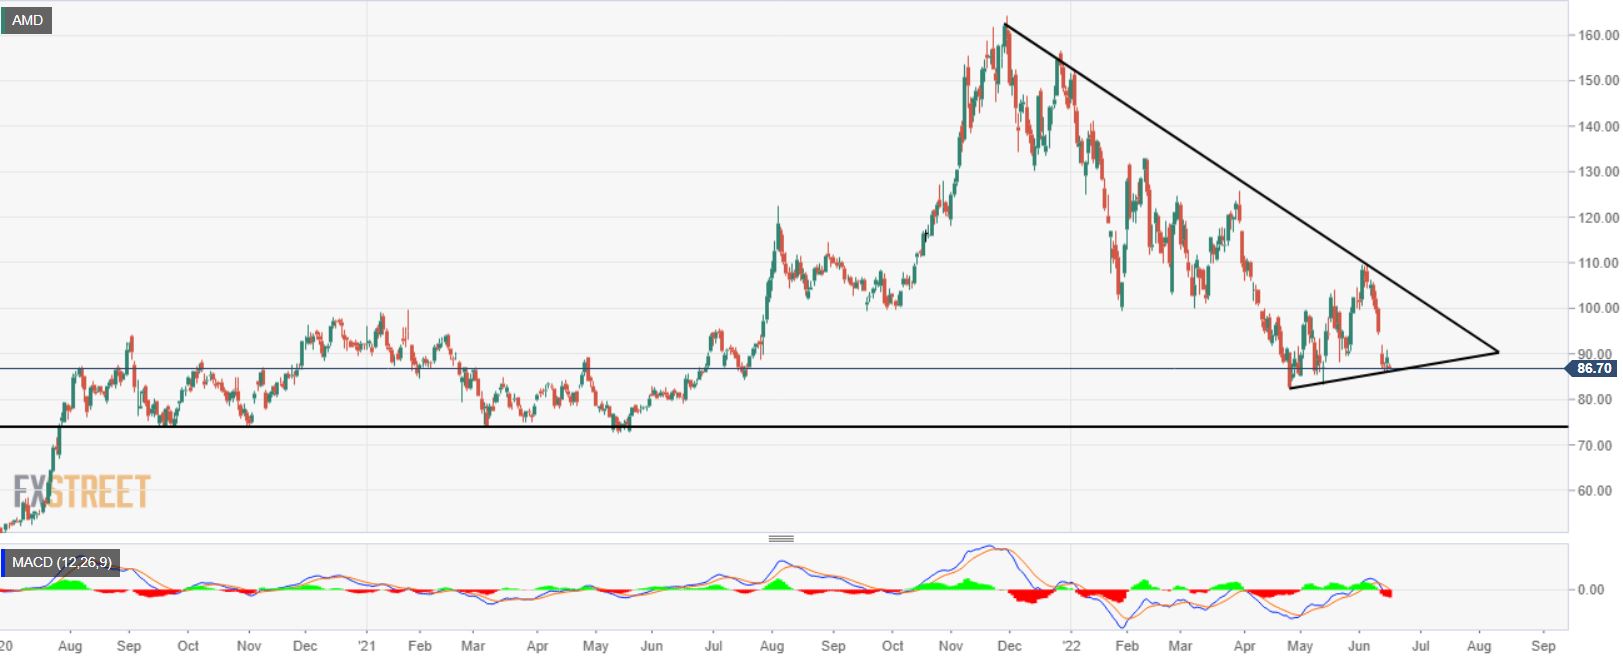
AMD daily chart
Previous updates
Update: Advanced Micro Devices (AMD) stock finished Thursday at $82.05 per share, down 8.12%. Panic selling took over Wall Street amid steepening recession fears. The Dow Jones Industrial Average shed 739 points, while the S&P 500 closed down 3.6%. Both indexes trade at levels last seen in January 2021. The Nasdaq Composite was the worst performer, down 453 points or 4.08%.
Speculative interest rushed into safety, as central banks seem to be doing too little, too late. On Thursday, the Switzerland National Bank hiked rates by 50 bps by surprise, while the Bank of England pulled the trigger as planned by 25 bps. UK policymakers refrained from stepping up bets amid concerns of slowing economic growth.
Update: Advanced Micro Devices (AMD) stock is trading down 2% to $87.54 in the Thursday premarket. This is near the bottom of the symmetrical wedge that AMD has traded within since April 26. Breaking through and closing below the bottom line support at $86.18 would signal the downtrend that began on November 30, 2021 will continue. If that indeed comes to pass, then AMD stock could quickly drop to long-term support at $74.
Like this article? Help us with some feedback by answering this survey:
Premium
You have reached your limit of 3 free articles for this month.
Start your subscription and get access to all our original articles.
Author

Clay Webster
FXStreet
Clay Webster grew up in the US outside Buffalo, New York and Lancaster, Pennsylvania. He began investing after college following the 2008 financial crisis.


