Advanced Micro Devices Inc. (AMD) Elliott Wave technical analysis [Video]
![Advanced Micro Devices Inc. (AMD) Elliott Wave technical analysis [Video]](https://editorial.fxstreet.com/images/TechnicalAnalysis/ChartPatterns/Chartism/foreign-exchange-market-chart-69068965_XtraLarge.jpg)
AMD Elliott Wave Analysis Trading Lounge
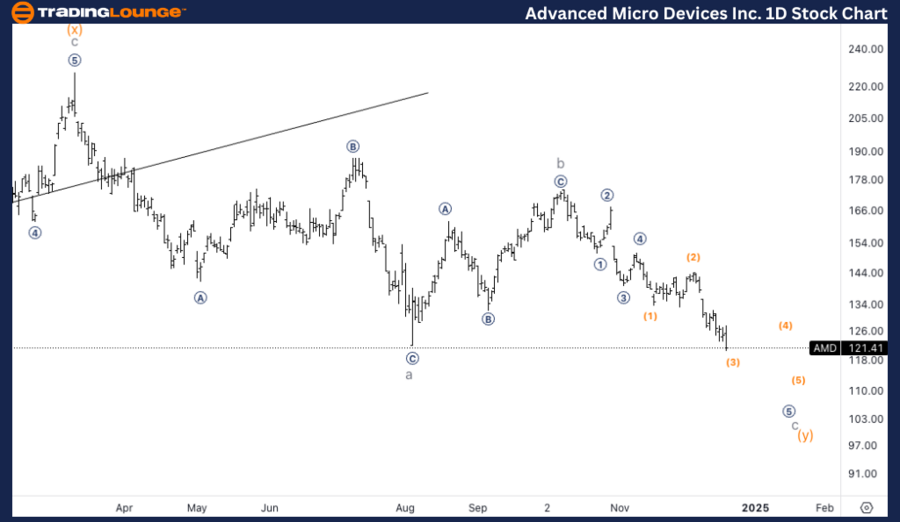
Advanced Micro Devices Inc., (AMD) Daily Chart
AMD Elliott Wave technical analysis
Function: Counter Trend
Mode: Corrective
Structure: Complex
Position: Wave c of (y) of {iv}.
Direction: Downside into wave c.
Details: Looking for continuation lower into wave c as we found resistance on top of TradingLevel2 at 200$ and we are now back at 120$ where we could be facing some support as we continue lower.
AMD Elliott Wave technical analysis – Daily chart
The daily chart suggests that AMD is in a corrective structure as part of wave {iv}, specifically in wave c of a complex correction (y). After hitting resistance at TradingLevel2 near $200, the stock has fallen back to $120, where support may emerge. However, further downside is expected before this correction completes. Wave c of (y) could extend lower before we see a potential reversal.
AMD Elliott Wave technical analysis
Function: Counter Trend.
Mode: Corrective.
Structure: Complex.
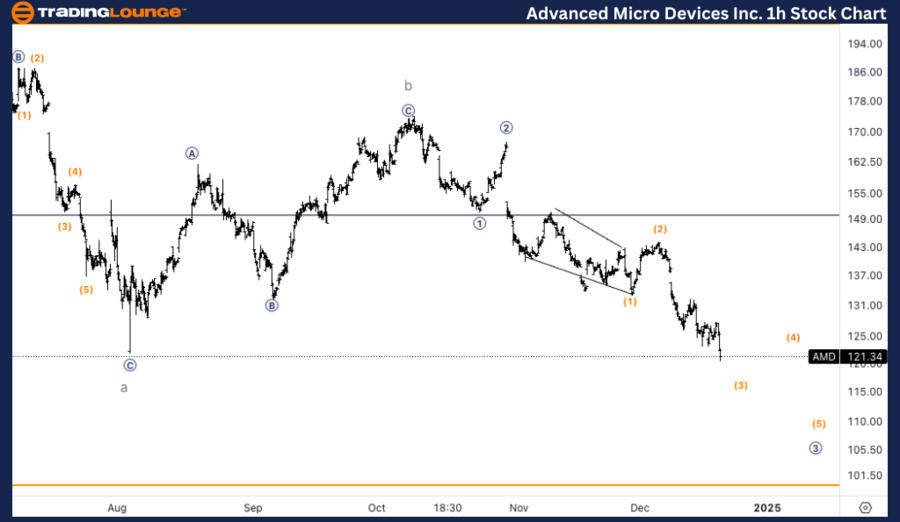
Position: Wave (3) of micro 3.
Direction: Downside in wave 3.
Details: Looking for continuation lower in what could be supermicro wave (3) of micro 3. This is an alternate subdivision of what could be happening inside wave c.
AMD Elliott Wave technical analysis – One-hour chart
On the 1-hour chart, AMD appears to be in the middle of wave (3) of micro wave 3, which is part of the larger wave cstructure. This could suggest another leg lower as the correction continues to unfold. The current wave count implies an internal subdivision, potentially indicating more downward movement in supermicro wave (3) of micro 3. Further downside pressure is likely in the short term as the correction progresses.
This Elliott Wave analysis of Analog Devices Inc., (ADI) outlines both the daily and 1-hour chart structures, highlighting the current trends and possible future price movements.
Advanced Micro Devices Inc. (AMD) Elliott Wave technical analysis [Video]
Author

Peter Mathers
TradingLounge
Peter Mathers started actively trading in 1982. He began his career at Hoei and Shoin, a Japanese futures trading company.


