|

Advanced Micro Devices ($AMD) perfect reaction higher from blue box area

Hello Traders! In today’s article, we will look at the past performance of the 1 Hour Elliottwave chart of $AMD. The rally from 1.06.2023 low unfolded as 5 waves which created a bullish sequence in our system. Therefore, we knew that the structure in $AMD is incomplete to the upside & should see more strength in 3, 7 or 11 swings against 1.06.2023 low. So, we advised members to buy the bounces in 3, 7, or 11 swings at the blue box area. We will explain the structure & forecast below:

$AMD 1H Elliott Wave chart 2.17.2023

Chart

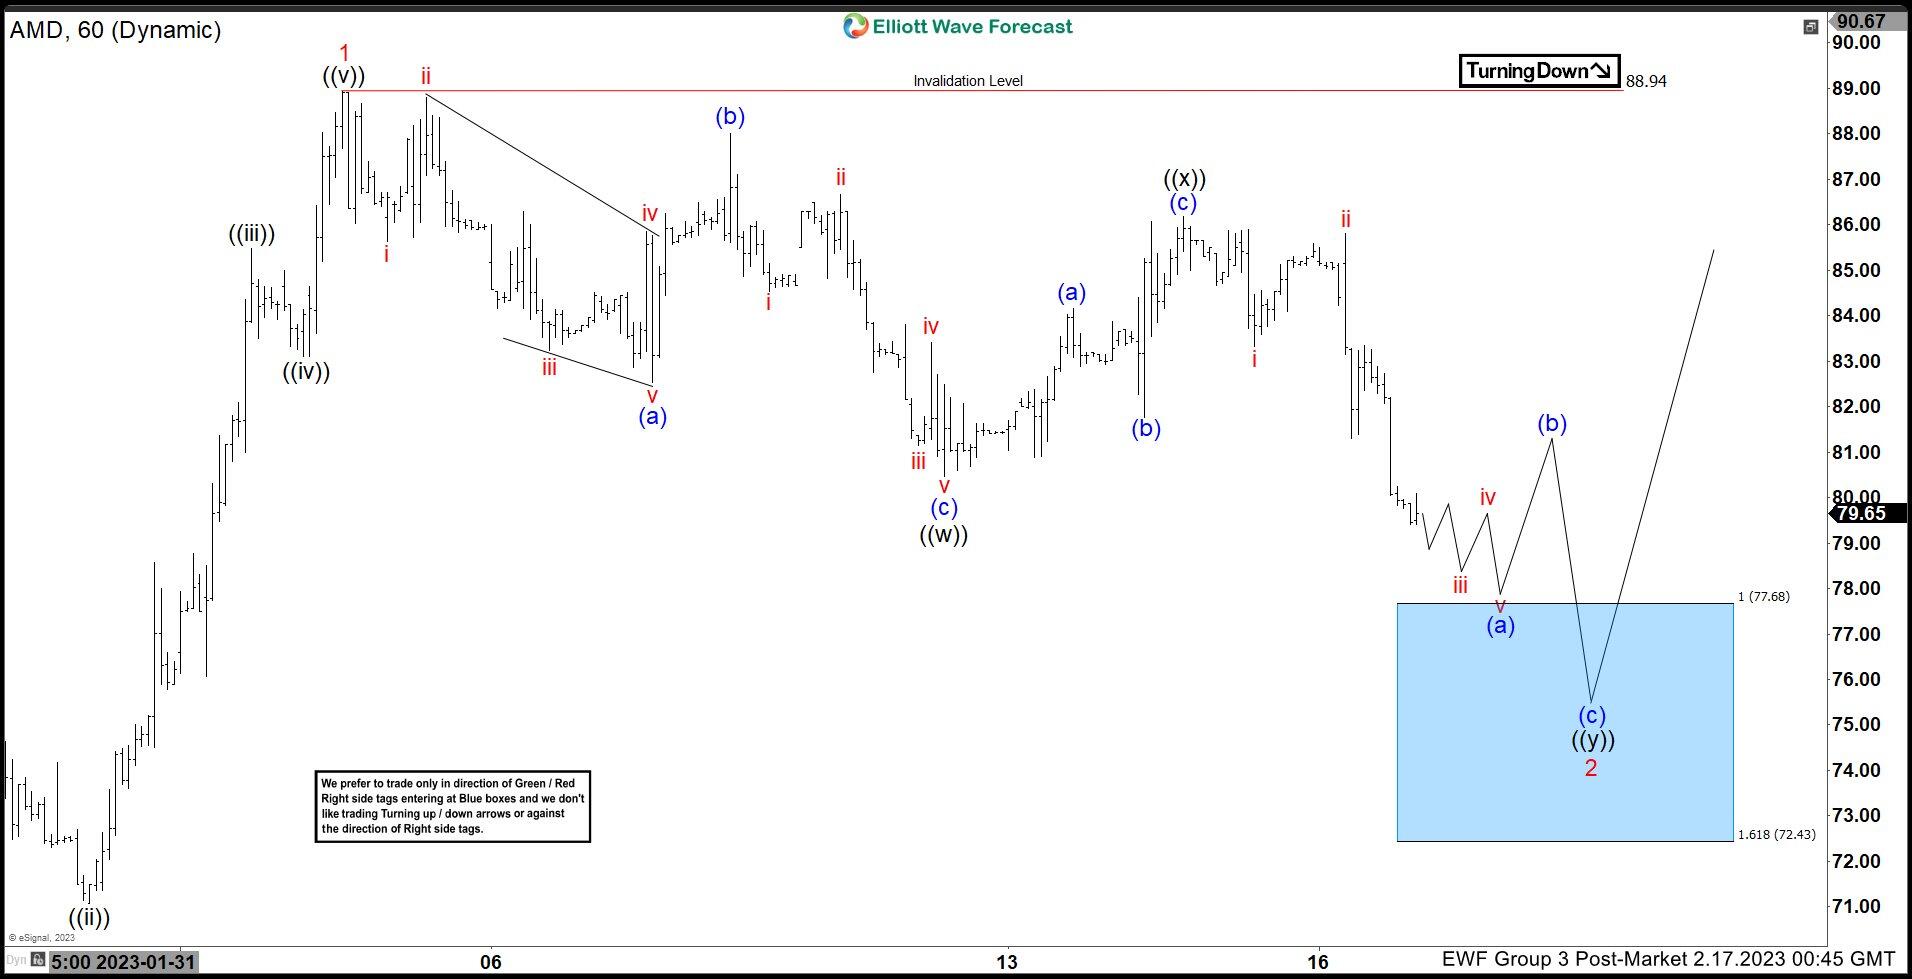
Here is the 1H Elliottwave count from 2.17.2023. We were calling for the decline to find buyers in 3 swings at red 2 where we like to buy it at the equal legs at $77.68 with a stop at $72.43.

$AMD latest Elliott Wave chart

Chart

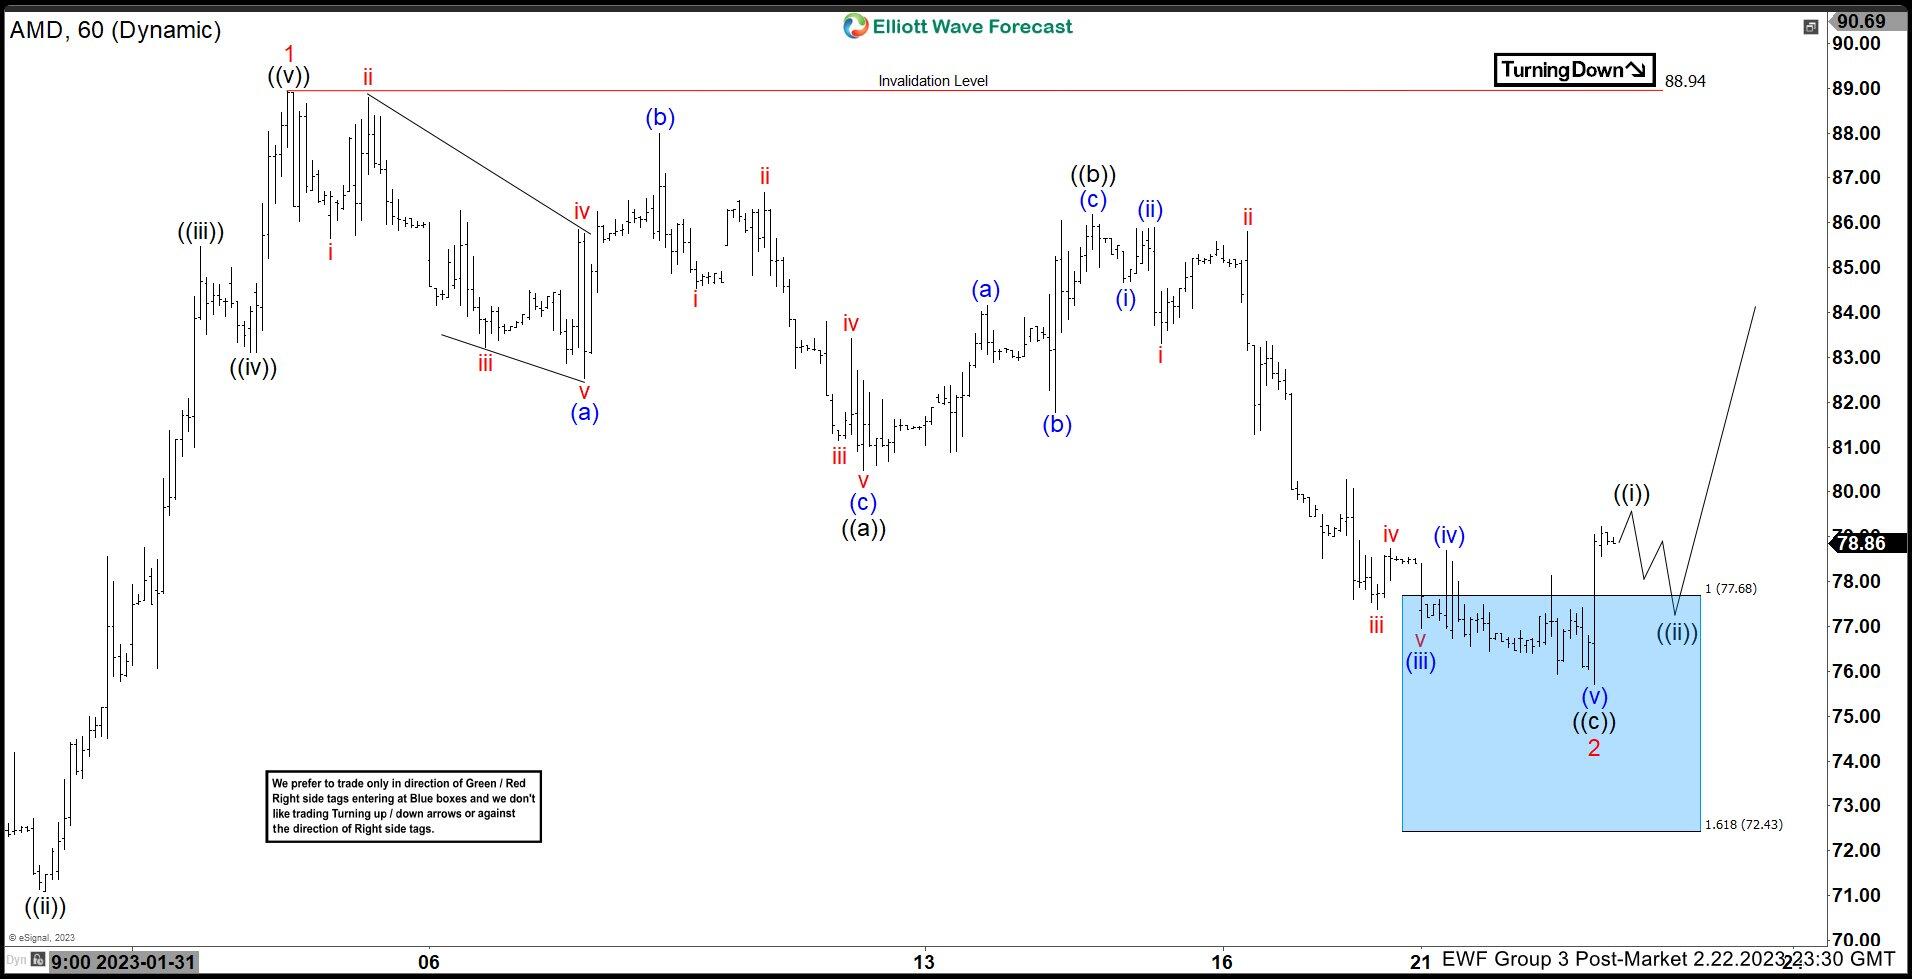
Here is the 2.22.2023 1H chart showing the move taking place as expected. The stock has reacted higher from the blue box to reach the 50% back from black ((b)) allowing any shorts to get risk free shortly after taking the position. We like to remain long targeting the equal legs area at $104.

Author

Elliott Wave Forecast Team

Elliott Wave Forecast Team

ElliottWave-Forecast.com

More from Elliott Wave Forecast Team
Share:

Editor's Picks

EUR/USD makes a U-turn, focus on 1.1900

EUR/USD’s recovery picks up further pace, prompting the pair to retarget the key 1.1900 barrier amid further loss of momentum in the US Dollar on Wednesday. Moving forward, investors are expected to remain focused on upcoming labour market figures and the always relevant US CPI prints on Thursday and Friday, respectively.

GBP/USD sticks to the bullish tone near 1.3660

GBP/USD maintains its solid performance on Wednesday, hovering around the 1.3660 zone as the Greenback surrenders its post-NFP bounce. Cable, in the meantime, should now shift its attention to key UK data due on Thursday, including preliminary GDP gauges.

Gold holds on to higher ground ahead of the next catalyst

Gold keeps the bid tone well in place on Wednesday, retargeting the $5,100 zone per troy ounce on the back of modest losses in the US Dollar and despite firm US Treasury yields across the curve. Moving forward, the yellow metal’s next test will come from the release of US CPI figures on Friday.

Ripple Price Forecast: XRP sell-side pressure intensifies despite surge in addresses transacting on-chain 

Ripple (XRP) is edging lower around $1.36 at the time of writing on Wednesday, weighed down by low retail interest and macroeconomic uncertainty, which is accelerating risk-off sentiment.

US jobs data surprises to the upside, boosts stocks but pushes back Fed rate cut expectations

This was an unusual payrolls report for two reasons. Firstly, because it was released on  Wednesday, and secondly, because it included the 2025 revisions alongside the January NFP figure.

XRP sell-off deepens amid weak retail interest, risk-off sentiment

Ripple (XRP) is edging lower around $1.36 at the time of writing on Wednesday, weighed down by low retail interest and macroeconomic uncertainty, which is accelerating risk-off sentiment.