Analog Devices, Inc. ADI is a global leader in designing and manufacturing integrated circuits and analog, mixed-signal, and digital signal processing (DSP). Founded in 1965, the company specializes in converting real-world phenomena like sound, light, and temperature into digital data, which is crucial for various applications in industries such as automotive, healthcare, industrial automation, and communications.

Analog Devices went public in 1969 and trades on the NASDAQ under the ticker symbol $ADI. The company has a strong reputation for innovation and has consistently performed well financially, benefiting from the growing demand for advanced electronics and the expansion of connected devices across multiple industries.

ADI Elliott Wave analysis, weekly chart 09.04.2024

Chart

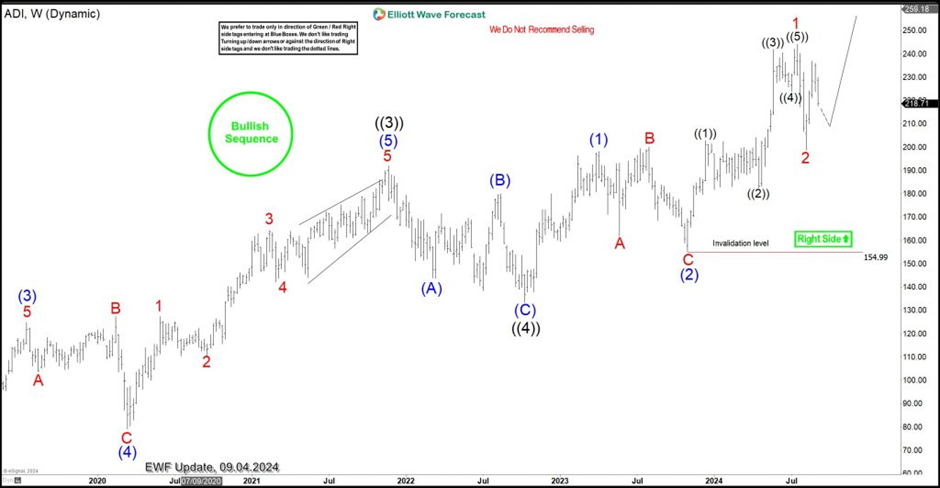
$ADI Weekly Chart (09.04.2024)

The right side is bullish against the all-time low. From the all-time low, the impulse sequence is advancing upwards for the Grand Super Cycle degree wave ((I)). Waves (I) and (II) of ((I)) were completed in August 2000 and December 2008, respectively. The bullish impulse sequence of Wave I of (III) has emerged from the December 2008 low. All of this can be observed on the monthly chart.

On the daily chart, the stock completed wave ((4)) of I in October 2022 and then rallied above the wave ((3)) high, confirming the progress of wave ((5)) of I. After completing waves (1) and (2) of ((5)), wave (3) is currently emerging from the October 2023 low of 154.99. In the minor degree, the price has completed waves 1 and 2 of (3) and is now in wave 3 of (5). A break above the top of wave 1 would confirm wave 3 if the current dip holds above 153.99. Therefore, the right trade plan is to wait for pullbacks in 3, 7, or 11 swings to buy from. At Elliottwave-Forecast, we provide the blue box on our chart where traders can find LONG and SHORT entries. The H4 chart below shows one such blue box on ADI as of August 5th, 2024.

ADI Elliott Wave analysis, four-hour chart 09.04.2024

Chart

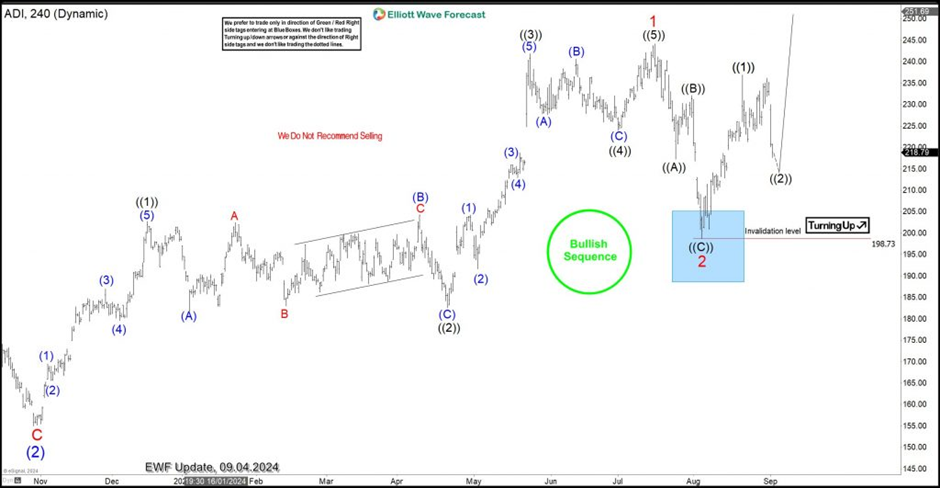
$ADI 4-Hour Chart (09.04.2024)

The H4 chart shows the blue box marking the end of wave 2 of (3). The pullback completed a zigzag, forming a 3-swing structure. Additionally, the blue box captured the extreme where buyers found an entry at the top of the box, with a stop loss placed a few points below the blue box. Wave 2 found support in the blue box as expected and rallied to a safe area. At the safe area, members can close half of the position in profit and adjust the rest to breakeven. This way, no matter what happens next, it’s already a winning trade.

What next?

1. The price completes wave ((2)) above 198.73 and rallies to break above the wave 1 high with wave ((3)). If this occurs, we will hold the current half position and add another long position at the blue box of the next pullback. The next pullback to buy could be wave (2) of ((3)), wave (4) of ((3)), or wave ((4)).

2. The price drops below 198.73. If this happens, the half position at breakeven will close. Afterward, wave 2 may extend lower, offering buyers an opportunity to buy from the next blue box.

Share: Feed news

FURTHER DISCLOSURES AND DISCLAIMER CONCERNING RISK, RESPONSIBILITY AND LIABILITY Trading in the Foreign Exchange market is a challenging opportunity where above average returns are available for educated and experienced investors who are willing to take above average risk. However, before deciding to participate in Foreign Exchange (FX) trading, you should carefully consider your investment objectives, level of xperience and risk appetite. Do not invest or trade capital you cannot afford to lose. EME PROCESSING AND CONSULTING, LLC, THEIR REPRESENTATIVES, AND ANYONE WORKING FOR OR WITHIN WWW.ELLIOTTWAVE- FORECAST.COM is not responsible for any loss from any form of distributed advice, signal, analysis, or content. Again, we fully DISCLOSE to the Subscriber base that the Service as a whole, the individual Parties, Representatives, or owners shall not be liable to any and all Subscribers for any losses or damages as a result of any action taken by the Subscriber from any trade idea or signal posted on the website(s) distributed through any form of social-media, email, the website, and/or any other electronic, written, verbal, or future form of communication . All analysis, trading signals, trading recommendations, all charts, communicated interpretations of the wave counts, and all content from any media form produced by www.Elliottwave-forecast.com and/or the Representatives are solely the opinions and best efforts of the respective author(s). In general Forex instruments are highly leveraged, and traders can lose some or all of their initial margin funds. All content provided by www.Elliottwave-forecast.com is expressed in good faith and is intended to help Subscribers succeed in the marketplace, but it is never guaranteed. There is no “holy grail” to trading or forecasting the market and we are wrong sometimes like everyone else. Please understand and accept the risk involved when making any trading and/or investment decision. UNDERSTAND that all the content we provide is protected through copyright of EME PROCESSING AND CONSULTING, LLC. It is illegal to disseminate in any form of communication any part or all of our proprietary information without specific authorization. UNDERSTAND that you also agree to not allow persons that are not PAID SUBSCRIBERS to view any of the content not released publicly. IF YOU ARE FOUND TO BE IN VIOLATION OF THESE RESTRICTIONS you or your firm (as the Subscriber) will be charged fully with no discount for one year subscription to our Premium Plus Plan at $1,799.88 for EACH person or firm who received any of our content illegally through the respected intermediary’s (Subscriber in violation of terms) channel(s) of communication.

Recommended content


Recommended content

Editors’ Picks

EUR/USD retakes 1.1100 ahead of key US data

EUR/USD retakes 1.1100 ahead of key US data

EUR/USD has regained upside traction to trade near 1.1100 in the European session on Thursday. The pair capitalizes on the extended US Dollar even as risk sentiment remains sour heading into the key US labor market data. 

EUR/USD News
GBP/USD advances toward 1.3200, US data eyed

GBP/USD advances toward 1.3200, US data eyed

GBP/USD extends gains toward 1.3200 in European trading on Thursday, as the US Dollar sees fresh selling. The further upside, however, could be capped as traders stay cautious ahead of the top-tier US jobs data. 

GBP/USD News
Gold recovers back above $2,500 after US job’s data

Gold recovers back above $2,500 after US job’s data

Gold trades back above $2,500 on Thursday after rebounding from the $2,471 previous day’s lows, following the release of lower-than-expected job openings data in July from the US, which stoked fresh hard-landing fears. 

Gold News
ADP Employment Change Preview: US private sector expected to add 145K new jobs in August

ADP Employment Change Preview: US private sector expected to add 145K new jobs in August

ADP Employment Change is forecast to arrive at 145,000 in August. Labor market conditions could influence the Fed’s policy outlook. The US Dollar stays resilient against its rivals after posting large losses in August.

Read more
Jupiter price is poised for a rally after retesting major support area

Jupiter price is poised for a rally after retesting major support area

Jupiter rebounded 4.4% after testing a key support area on Wednesday. Despite a slight 1.4% dip on Thursday, a sustained reversal appears likely if the support zone continues to hold. 

Read more
Moneta Markets review 2024: All you need to know

Moneta Markets review 2024: All you need to know

VERIFIED In this review, the FXStreet team provides an independent and thorough analysis based on direct testing and real experiences with Moneta Markets – an excellent broker for novice to intermediate forex traders who want to broaden their knowledge base.

Read More

Forex MAJORS

Cryptocurrencies

Signatures