ADI Elliott Wave technical analysis [Video]
![ADI Elliott Wave technical analysis [Video]](https://editorial.fxstreet.com/images/Markets/Equities/DowJones/dow-jones-industrial-average-on-iphone-4-stocks-app-16978003_XtraLarge.jpg)
ADI Elliott Wave Analysis Trading Lounge.
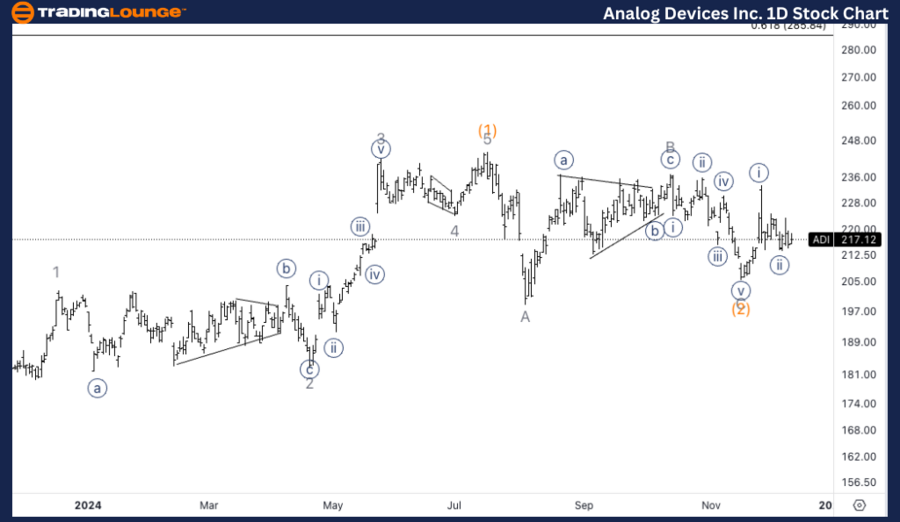
Analog Devices Inc., (ADI) Daily Chart.
ADI Elliott Wave technical analysis
Function: Trend.
Mode: Impulsive.
Structure: Motive.
Position: Wave {ii} of 1.
Direction: Upside into wave {iii}.
Details: Looking for a bottom in wave {ii} to then continue higher as we are currently trading within the range of Minor Group1 at 210-230$.
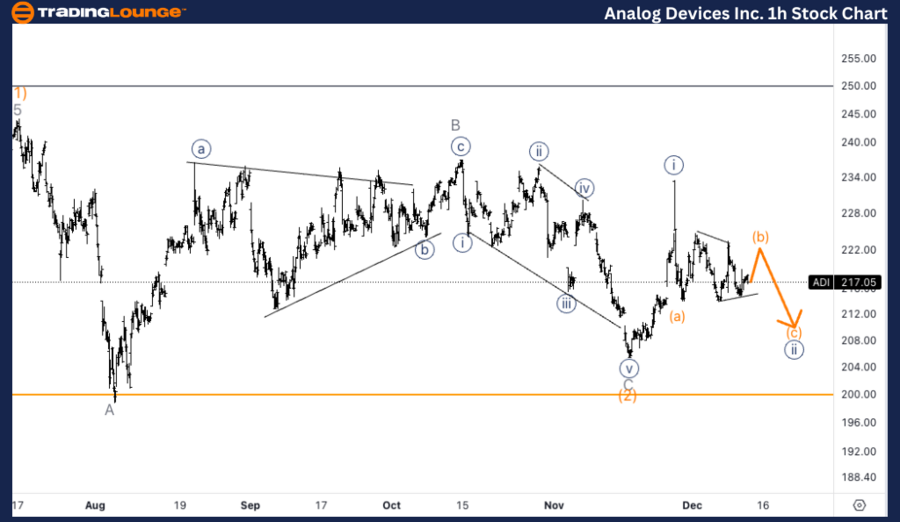
Analog Devices Inc., (ADI) 1H Chart.
ADI Elliott Wave technical analysis
Function: Trend.
Mode: Impulsive.
Structure: Motive.
Position: Wave (b) of {ii}.
Direction: Bottom in wave {ii}.
Details: This would be the only scenario suggesting we ae in a wave {ii} and we are headed towards the end of {ii} in wave (c) after a triangle in wave (b).
This Elliott Wave analysis of Analog Devices Inc., (ADI) outlines both the daily and 1-hour chart structures, highlighting the current trends and possible future price movements.
ADI Elliott Wave technical analysis – Daily chart
The daily chart suggests that ADI is in wave {ii} of a larger impulsive structure. The current price action is within the MinorGroup1 range of $210-$230, indicating that a bottom may be forming soon. After this, we expect wave {ii} to complete, leading to a strong move upward into wave {iii}.
ADI Elliott Wave technical analysis – 1H chart
The 1-hour chart shows that ADI is currently in wave (b) of {ii}, and a triangle pattern seems to have formed in this corrective wave. The next move is expected to be a drop into wave (c) of {ii}, completing the correction before a bullish reversal takes place in wave {iii}.
Technical analyst: Alessio Barretta.
ADI Elliott Wave technical analysis [Video]
Author

Peter Mathers
TradingLounge
Peter Mathers started actively trading in 1982. He began his career at Hoei and Shoin, a Japanese futures trading company.


