Adani Power Elliott Wave technical analysis [Video]
![Adani Power Elliott Wave technical analysis [Video]](https://editorial.fxsstatic.com/images/i/General-Stocks_3_XtraLarge.png)
Adani Power Elliott Wave technical analysis
-
Function: Counter Trend (Intermediate Degree, Orange).
-
Mode: Corrective.
-
Structure: Potential Impulse within Larger Degree Zigzag.
-
Position: Minute Wave ((iv)) Navy.
-
Details:
-
Minute Wave ((iv)) Navy may have completed around 600 mark within Minor Wave 1 against 800 resistance.
-
If this is correct, Minute Wave ((v)) is now in progress.
-
-
Invalidation point: 800.
Adani Power – Daily chart technical analysis and Elliott Wave counts
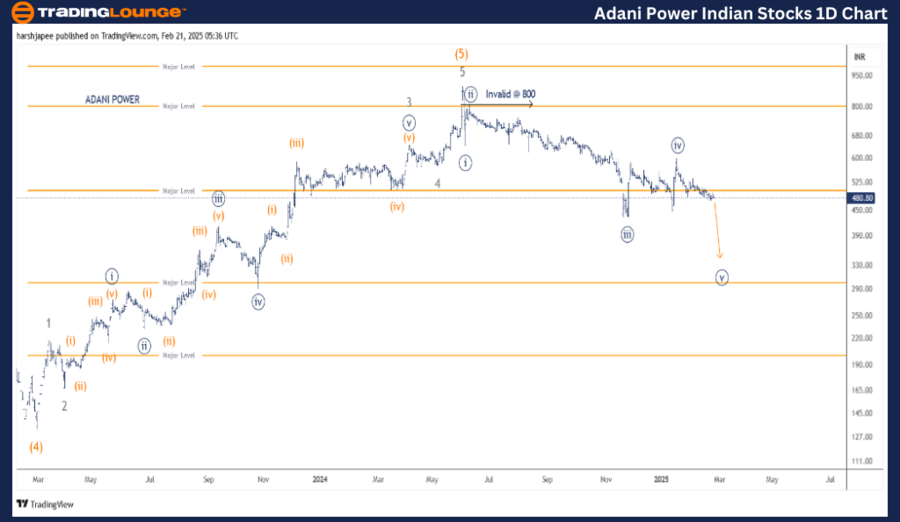
The Adani Power daily chart suggests that a major top was formed around the 900 mark in Intermediate Wave (5) Orange in June 2024.
-
A downward impulse wave is currently unfolding at Minute Degree, dragging prices towards 300 levels as bears maintain control against the 800 resistance.
-
Previously, the stock dropped to the 130 mark in February 2023, terminating Intermediate Wave (4) Orange.
-
Since then, a Minor Degree impulse wave (Waves 1 through 5) led the price up to 900 before reversing sharply.
-
The stock is now in a downward movement, approaching its first impulse termination at Minor Degree.
Adani Power Elliott Wave technical analysis
-
Function: Counter Trend (Intermediate Degree, Orange).
-
Mode: Corrective.
-
Structure: Potential Impulse within Larger Degree Zigzag.
-
Position: Minute Wave ((iv)) Navy.
-
Details:
-
Minute Wave ((iv)) Navy might have completed around 600 mark within Minor Wave 1 against 800 resistance.
-
If this structure holds, Minute Wave ((v)) is now underway, with a potential target around 306.
-
-
Invalidation point: 800.
Adani Power– Four-chart chart technical analysis and Elliott Wave counts
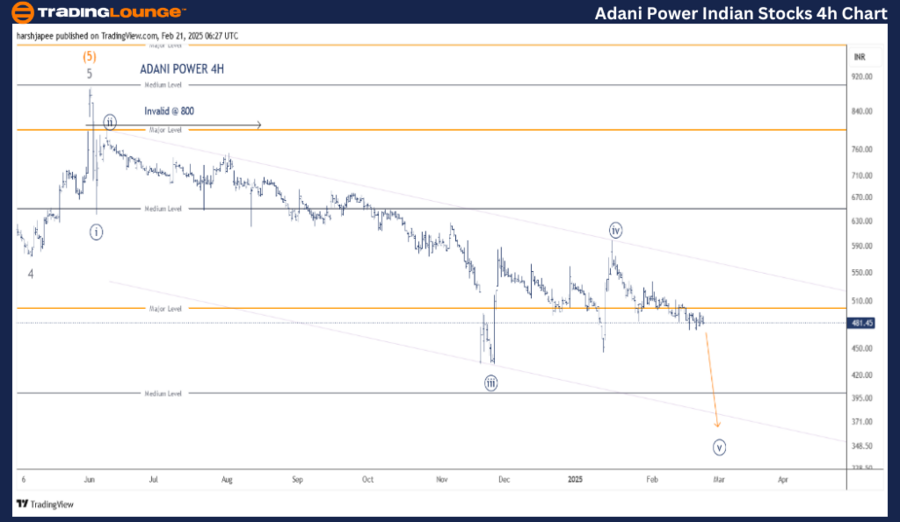
The ADANI POWER 4H chart highlights its sub-waves after completing Intermediate Wave (5) Orange around 900 in June 2024.
- Minute Waves ((i)) through ((iv)) have formed at 640, 800, 430, and 600 levels, respectively.
- If the wave count remains valid, prices should stay below the 600 mark and continue downward towards 306, marking the completion of Minute Wave ((v)).
Conclusion
ADANI POWER is progressing lower towards the 306 mark, where Minute Wave ((v)) is expected to terminate.
Adani Power Elliott Wave technical analysis [Video]
Author

Peter Mathers
TradingLounge
Peter Mathers started actively trading in 1982. He began his career at Hoei and Shoin, a Japanese futures trading company.


