ADANIGREEN Elliott Wave technical analysis

Function: Counter Trend (Intermediate degree, orange).

Mode: Corrective.

Structure: Flat.

Position: Minor Wave C Grey.

Details: Minor Wave C Grey could be underway against 2190, to terminate Intermediate Wave (4) Orange. Further it is subdividing as an impulse with Minute Wave ((iii)) in progress.

Invalidation point: 2190.

ADANI

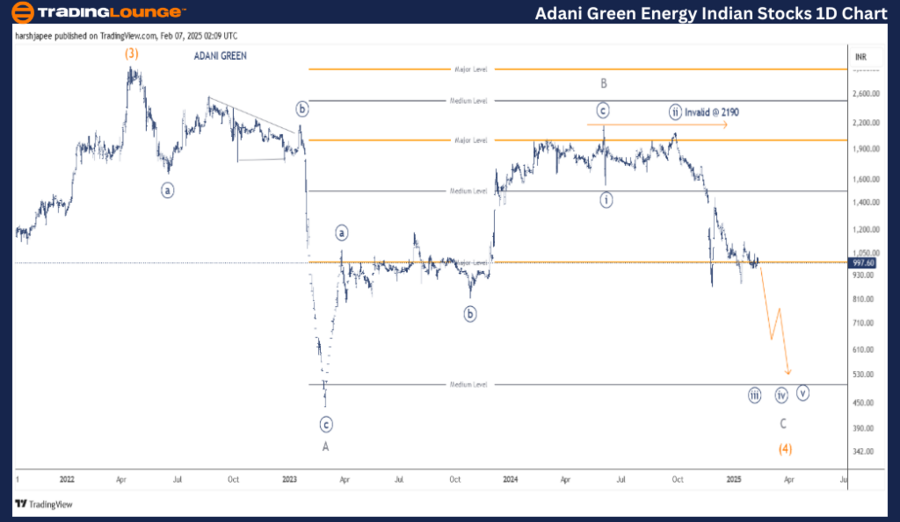
Adani Green Energy daily chart technical analysis and potential Elliott Wave counts

ADANI GREEN ENERGY daily chart indicates the stock is carving a corrective wave at Intermediate degree after hitting 3060 high in April 2022. Minor Waves A and B seem to be in place around 440 and 2190 levels respectively as bears are poised to unfold Wave C lower.

Alternatively, if prices push higher through 1550 mark, the above bearish view would be nullified and we shall re-look into the wave structure. For now, the immediate level to watch is 875 for a break out on the south side.

ADANIGREEN Elliott Wave technical analysis

Function: Counter Trend (Intermediate degree, orange).

Mode: Corrective.

Structure: Flat.

Position: Minor Wave C Grey.

Details: Minor Wave C Grey could be underway against 2190, to terminate Intermediate Wave (4) Orange. Further it is subdividing as an impulse with Minute Wave ((iii)) in progress. The Minuette waves (not labelled) are unfolding to terminate Minute Wave ((iii)) towards 566 levels.

Invalidation point: 2190.

ADANI

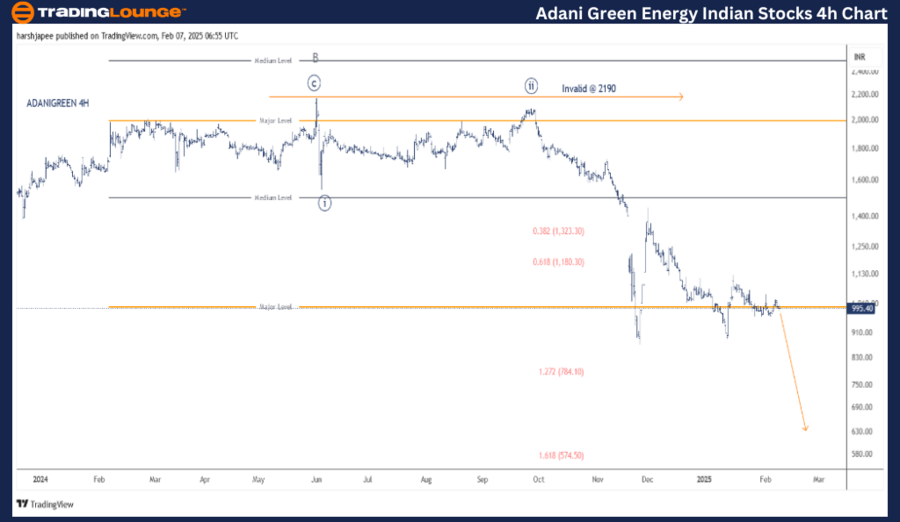
Adani Green Energy four-hour chart technical analysis and potential Elliott Wave counts

ADANI GREEN ENERGY 4H chart is highlighting the sub waves after post Minor Wave B termination around 2190 in May 2024. Minute Waves ((i)) and ((ii)) are in place around 1550 and 2100 levels respectively. Since then, Minute Wave ((iii)) has been unfolding as an extension.

Minute Wave ((iii)) is potentially targeting 577 lows, and a break below 875 would accelerate. Minor Wave C is expected to terminate around 400 levels subsequently terminating Intermediate Wave (4) Orange. Only a push above 1550 mark would invalidate.

Conclusion

ADANI GREEN ENERGY is progressing lower towards 400 levels within Minor Wave C of Intermediate Wave (4) Orange.

Adani Green Energy Elliott Wave technical analysis [Video]

Share: Feed news

As with any investment opportunity there is a risk of making losses on investments that Trading Lounge expresses opinions on.

Historical results are no guarantee of future returns. Some investments are inherently riskier than others. At worst, you could lose your entire investment. TradingLounge™ uses a range of technical analysis tools, software and basic fundamental analysis as well as economic forecasts aimed at minimizing the potential for loss.

The advice we provide through our TradingLounge™ websites and our TradingLounge™ Membership has been prepared without considering your objectives, financial situation or needs. Reliance on such advice, information or data is at your own risk. The decision to trade and the method of trading is for you alone to decide. This information is of a general nature only, so you should, before acting upon any of the information or advice provided by us, consider the appropriateness of the advice considering your own objectives, financial situation or needs. Therefore, you should consult your financial advisor or accountant to determine whether trading in securities and derivatives products is appropriate for you considering your financial circumstances.

Trading Pro
Read review
Pepperstone
Read review
Trading Pro
Read review
Pepperstone
Read review

Recommended content


Recommended content

Editors’ Picks

AUD/USD: Further gains need more conviction

AUD/USD: Further gains need more conviction

AUD/USD reversed two-daily pullbacks in a row on Tuesday, staging a decent comeback from Monday’s troughs near 0.6220 to the boundaries of the 0.6300 hurdle propped up by the RBA hawkish hold and firm data from Chinese business activity.

AUD/USD News
EUR/USD remains offered below 1.0800 ahead of “Liberation Day”

EUR/USD remains offered below 1.0800 ahead of “Liberation Day”

EUR/USD came under extra downside pressure on Tuesday, returning to the sub-1.0800 region on the back of tepid gains in the US Dollar and rising caution prior to Trump’s announcements on Wednesday.

EUR/USD News
Gold nears $3,100 as fears receded

Gold nears $3,100 as fears receded

Gold is easing from its fresh record high near $3,150 but remains well supported above the $3,100 mark. A generalised pullback in US yields is underpinning the yellow metal, as traders stay on the sidelines awaiting clarity on upcoming US tariff announcements.

Gold News
Bitcoin just as vulnerable as major assets – Anthony Yeung, Global Head of Strategic Development at CoinCover

Bitcoin just as vulnerable as major assets – Anthony Yeung, Global Head of Strategic Development at CoinCover

Bitcoin trades under the $85,000 mark, holding on to nearly 3% gains on Tuesday ahead of Donald Trump’s Liberation Day. Crypto traders remain fearful, the sentiment reads 34 on a scale of 0 to 100 on the Fear & Greed Index. 

Read more
Is the US economy headed for a recession?

Is the US economy headed for a recession?

Leading economists say a recession is more likely than originally expected. With new tariffs set to be launched on April 2, investors and economists are growing more concerned about an economic slowdown or recession.

Read more
The Best brokers to trade EUR/USD

The Best brokers to trade EUR/USD

SPONSORED Discover the top brokers for trading EUR/USD in 2025. Our list features brokers with competitive spreads, fast execution, and powerful platforms. Whether you're a beginner or an expert, find the right partner to navigate the dynamic Forex market.

Read More

Forex MAJORS

Cryptocurrencies

Signatures

Best Brokers of 2025