|

Active bullish chart patterns to bolster AAPL?

APPL prints largest one-day gain in months

Major US equity indices rallied across the board yesterday; the S&P 500 added nearly +1.0% (and formed a half-hearted daily morning star pattern [it does not precede a meaningful decline, hence half-hearted]). Large tech names led the way in recent movement, and, unsurprisingly, the price of Apple (AAPL), due to its large weight in the S&P, gapped higher and delivered its largest one-day gain in months.

Technically speaking

Now, technically, this is a market poised to extend recovery gains.

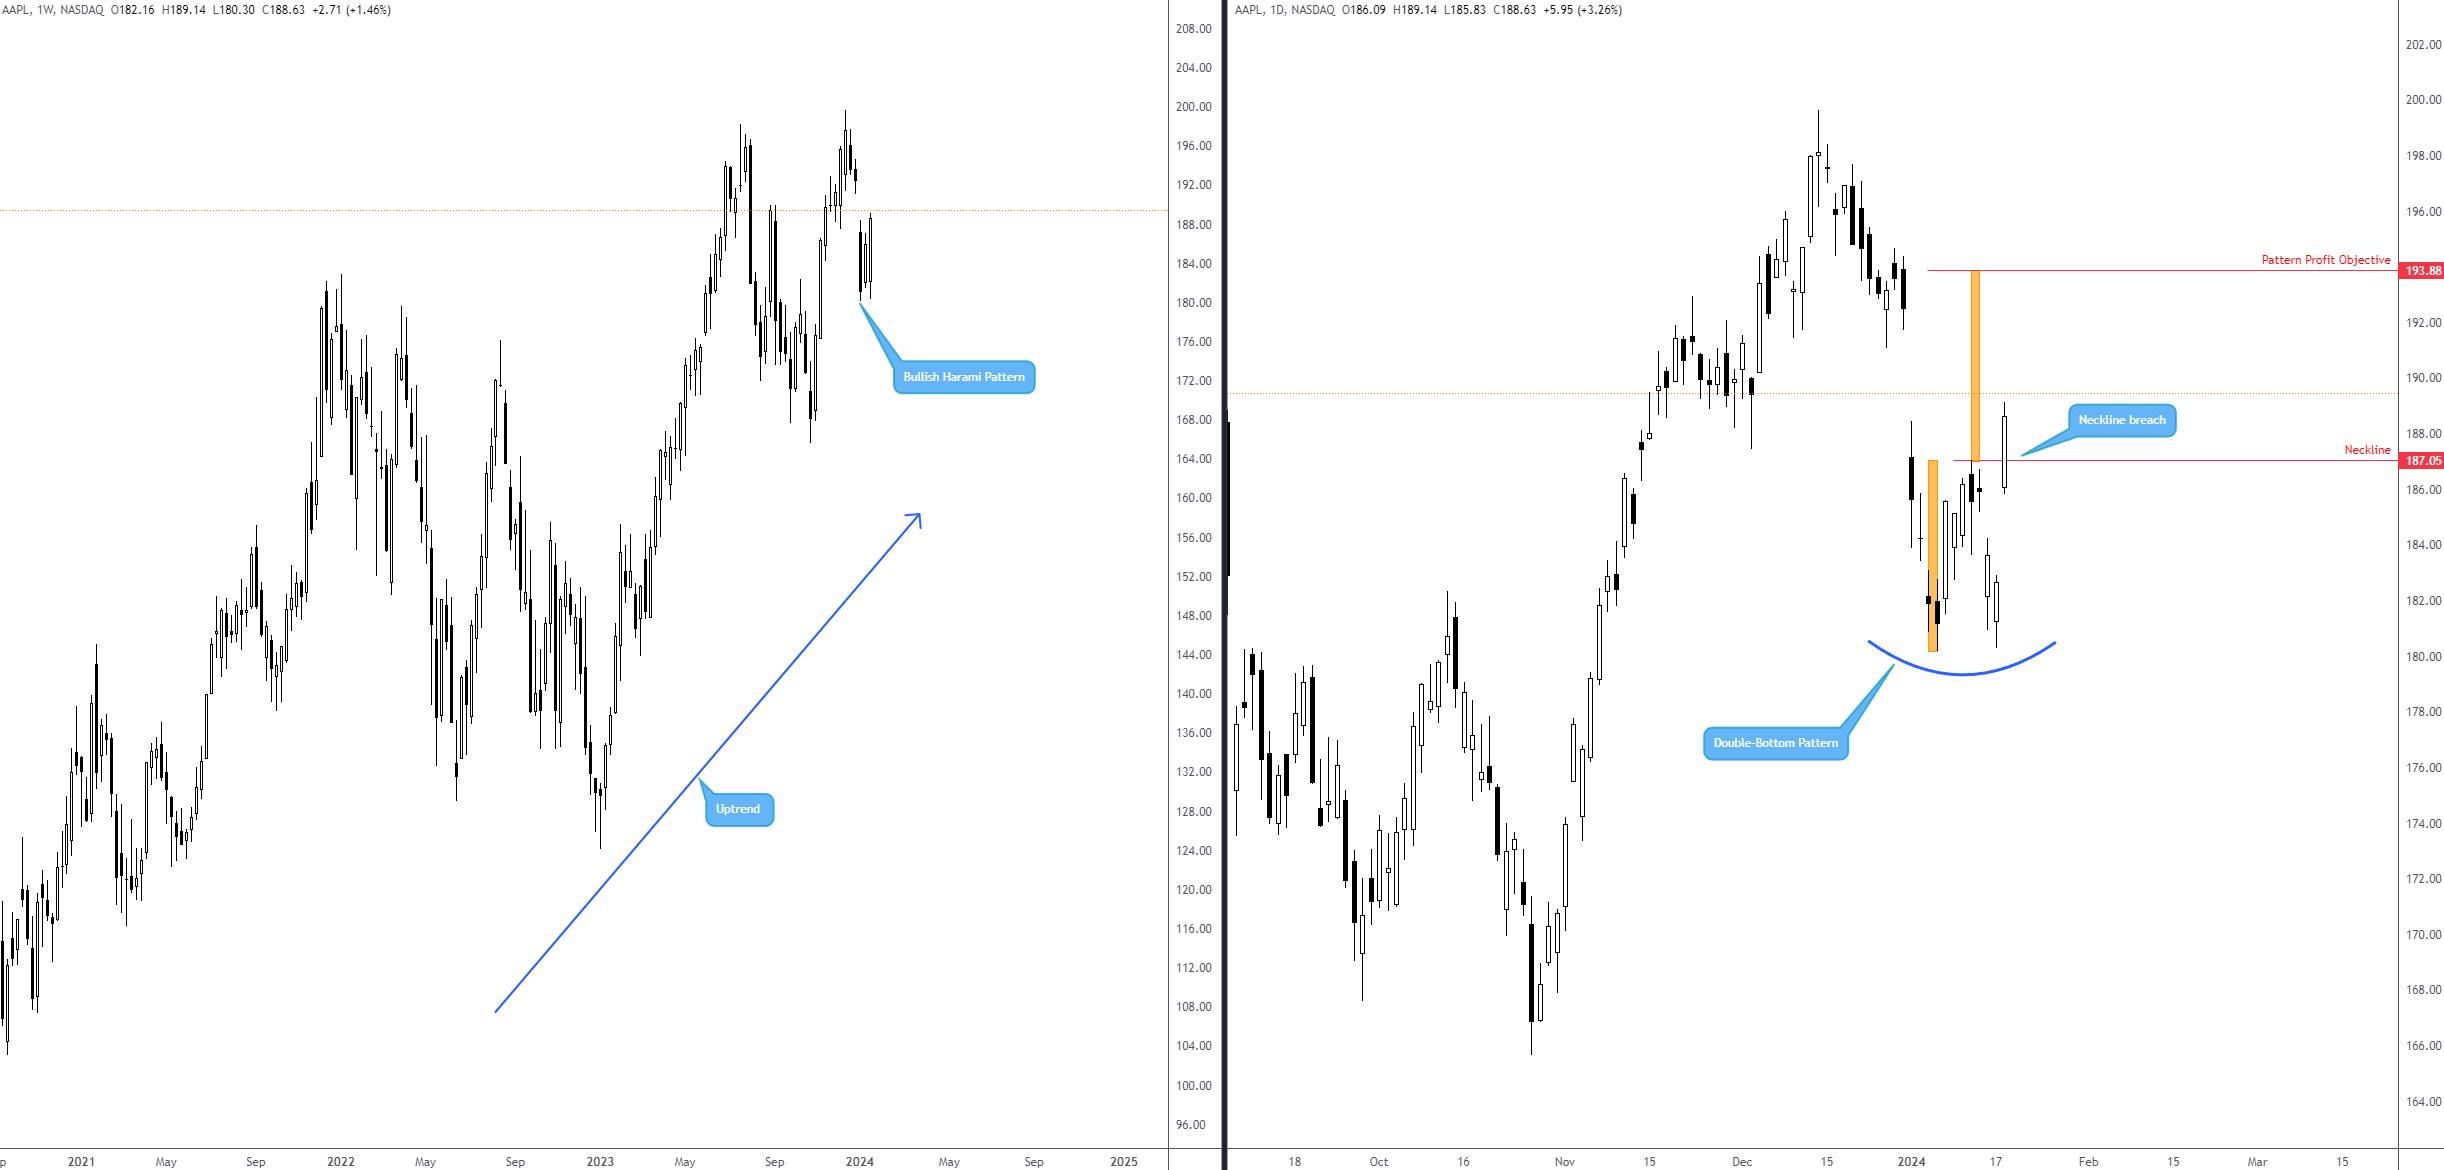
Kicking off from the weekly timeframe, the first and most obvious technical observation is the clear-cut uptrend that the stock is in. Couple this with the last week’s bullish Harami candlestick formation formed at the base of a correction from the all-time high of $199.62, and buyers appear to be in the driving seat. Note that traders who based a long off the aforementioned candlestick pattern are likely filled (usually, traders tend to set buy-stop orders north of the initial candle’s upper shadow).

Adding credibility to the weekly structure is the daily timeframe’s recently completed double-bottom pattern at $180.18. You will acknowledge that yesterday’s upside gap penetrated the pattern’s neckline at $187.05 and revealed the pattern’s profit objective at $193.88.

Taking the above into consideration, assuming AAPL remains north of the daily pattern’s neckline, this is a market that could attract further outperformance to fill the downside gap produced at the beginning of the year and touch gloves with the pattern’s profit objective at $193.88.

Chart

Author

Aaron Hill

Aaron Hill

FP Markets

After completing his Bachelor’s degree in English and Creative Writing in the UK, and subsequently spending a handful of years teaching English as a foreign language teacher around Asia, Aaron was introduced to financial trading,

More from Aaron Hill
Share:

Editor's Picks

EUR/USD hits two-day highs near 1.1820

EUR/USD picks up pace and reaches two-day tops around 1.1820 at the end of the week. The pair’s move higher comes on the back of renewed weakness in the US Dollar amid growing talk that the Fed could deliver an interest rate cut as early as March. On the docket, the flash US Consumer Sentiment improves to 57.3 in February.

GBP/USD reclaims 1.3600 and above

GBP/USD reverses two straight days of losses, surpassing the key 1.3600 yardstick on Friday. Cable’s rebound comes as the Greenback slips away from two-week highs in response to some profit-taking mood and speculation of Fed rate cuts. In addition, hawkish comments from the BoE’s Pill are also collaborating with the quid’s improvement.

Gold climbs further, focus is back to 45,000

Gold regains upside traction and surpasses the $4,900 mark per troy ounce at the end of the week, shifting its attention to the critical $5,000 region. The move reflects a shift in risk sentiment, driving flows back towards traditional safe haven assets and supporting the yellow metal.

Crypto Today: Bitcoin, Ethereum, XRP rebound amid risk-off, $2.6 billion liquidation wave

Bitcoin edges up above $65,000 at the time of writing on Friday, as dust from the recent macro-triggered sell-off settles. The leading altcoin, Ethereum, hovers above $1,900, but resistance at $2,000 caps the upside. Meanwhile, Ripple has recorded the largest intraday jump among the three assets, up over 10% to $1.35.

Three scenarios for Japanese Yen ahead of snap election

The latest polls point to a dominant win for the ruling bloc at the upcoming Japanese snap election. The larger Sanae Takaichi’s mandate, the more investors fear faster implementation of tax cuts and spending plans. 

XRP rally extends as modest ETF inflows support recovery

Ripple is accelerating its recovery, trading above $1.36 at the time of writing on Friday, as investors adjust their positions following a turbulent week in the broader crypto market. The remittance token is up over 21% from its intraday low of $1.12.