AbbVie Inc. (ABBV) Elliott Wave technical analysis [Video]
![AbbVie Inc. (ABBV) Elliott Wave technical analysis [Video]](https://editorial.fxstreet.com/images/Markets/Equities/Mexbolsa/mexican-stock-exchange-or-bolsa-mexicana-de-valores-mexico-city-45071436_XtraLarge.jpg)
ABBV Elliott Wave technical analysis
Function: Trend
Mode: Impulsive
Structure: Motive
Position: Minor wave 3.
Direction: Upside into wave 3.
Details: We are looking for Minor wave 3 to slowly and steadily unfolding to the upside, as we are witnessing continuation higher.
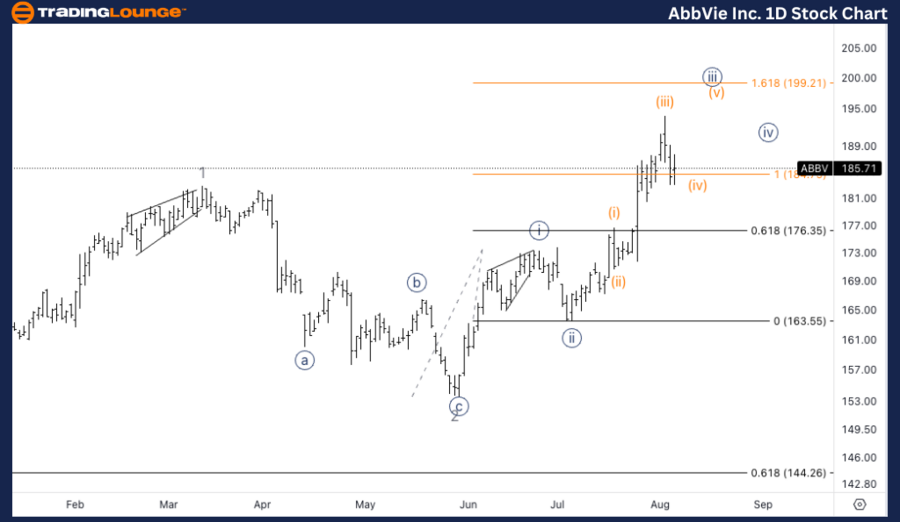
ABBV Elliott Wave technical analysis – Daily chart
We are observing the steady and gradual development of Minor wave 3, which is unfolding to the upside. This suggests a continuation of the upward trend, as the stock progresses through this impulsive wave.
ABBV Elliott Wave technical analysis
Function: Trend.
Mode: Impulsive.
Structure: Motive.
Position: Wave {iii} of 3.
Direction: Upside in wave {iii}.
Details: Looking for a series of threes and fours to take us higher to the minimum next target that is 1.618 {iii} vs. {i} at 200$.
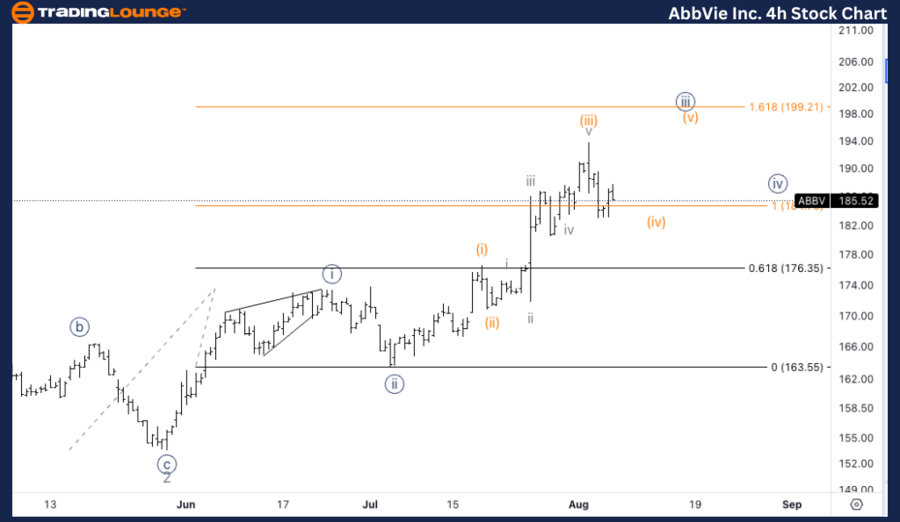
ABBV Elliott Wave technical analysis – Four-hour chart
The 4-hour chart shows a series of smaller three and four wave movements that are characteristic of a developing wave {iii}. The minimum next target is identified as 1.618 of wave {iii} vs. wave {i}, which is around $200. This target is anticipated based on the typical Fibonacci extension levels observed in wave {iii}.
Welcome to our latest Elliott Wave analysis for AbbVie Inc. (ABBV) as of July 31, 2024. This analysis provides an in-depth look at ABBV's price movements using the Elliott Wave Theory, helping traders identify potential opportunities based on current trends and market structure. We will cover insights from both the daily and 4-hour charts to offer a comprehensive perspective on ABBV's market behavior.
AbbVie Inc. (ABBV) Elliott Wave technical analysis [Video]
Author

Peter Mathers
TradingLounge
Peter Mathers started actively trading in 1982. He began his career at Hoei and Shoin, a Japanese futures trading company.


