Abbie Inc.(ABBV) stocks Elliott Wave technical analysis [Video]
![Abbie Inc.(ABBV) stocks Elliott Wave technical analysis [Video]](https://editorial.fxstreet.com/images/TechnicalAnalysis/ChartPatterns/Candlesticks/high-resolution-stock-exchange-evolution-panel-55741904_XtraLarge.jpg)
ABBV Elliott Wave technical analysis
Function: Trend.
Mode: Impulsive.
Structure: Motive.
Position: Minor 3.
Direction: Upside into wave {v} of 3.
Details: Looking for upside into wave {v} as we are trading within the parallel channel where we could eventually seek for support within wave {iv}.
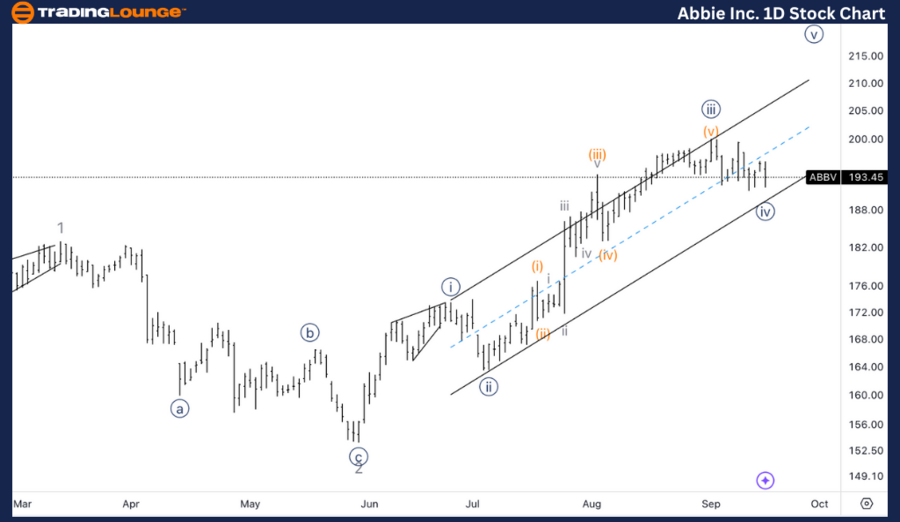
ABBV Elliott Wave technical analysis – Daily chart
On the daily chart, AbbVie is progressing through an impulsive trend, currently within Minor Wave 3. The stock is advancing into Wave {v} of 3, with a clear upside direction in play. ABBV is trading within a parallel channel, a typical feature in motive waves, providing guidance for potential support and resistance levels.
ABBV Elliott Wave technical analysis
Function: Trend.
Mode: Impulsive.
Structure: Motive.
Position: Wave {iv} of 3.
Direction: Bottom in wave {iv}.
Details: Looking for a potential complex correction in wave {iv}, as labelled on the chart. Alternatively we could look for a potential triangle in the making.
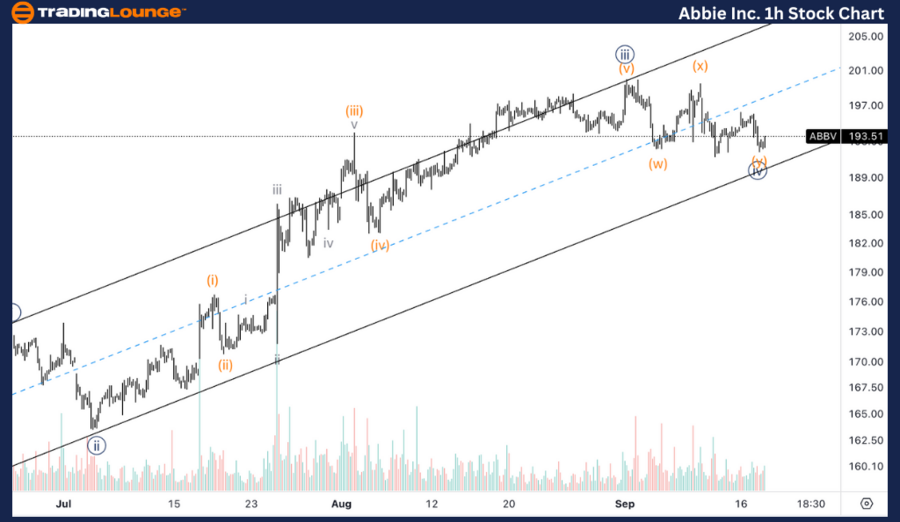
ABBV Elliott Wave technical analysis – One-hour chart
On the 1-hour chart, ABBV appears to be in Wave {iv} of 3, potentially nearing the end of a corrective phase. The current structure suggests a complex correction within Wave {iv}, which could involve more intricate corrective patterns such as a zigzag or a flat. Alternatively, there’s a possibility of a triangle pattern forming within this wave, a common structure in fourth waves.
This Elliott Wave analysis for AbbVie Inc. (ABBV), breaks down the stock’s current price action using Elliott Wave Theory, providing traders with insights into possible opportunities. We’ll explore both the daily and 1-hour charts for a more comprehensive outlook.
Abbie Inc.(ABBV) stocks Elliott Wave technical analysis [Video]
Author

Peter Mathers
TradingLounge
Peter Mathers started actively trading in 1982. He began his career at Hoei and Shoin, a Japanese futures trading company.


