AAPL Stock Forecast: Three reasons to buy Apple working perfectly, record highs within reach
- AAPL shares add another 1% so far on Tuesday and are close to breaking $137 resistance.
- Apple builds on Monday's strong bullish continuation candle, breaking $135.51.
- AAPL stock targetting next resistance at $137 where it can gap higher from.
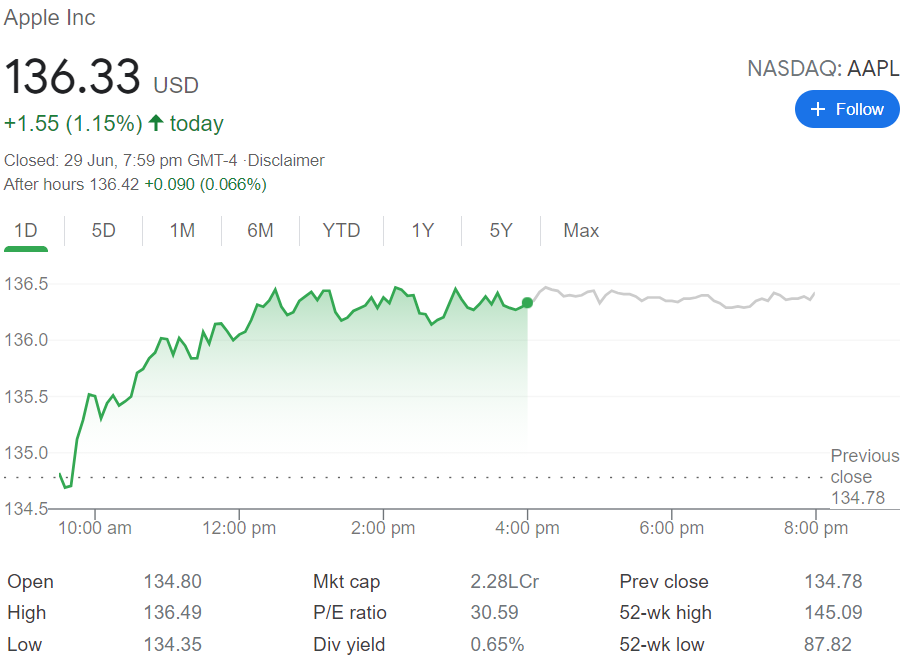
Update June 30: Apple shares kept pushing higher on Tuesday, sharply up for the second straight day, as they look to retest the record highs of $137.07. Despite a flat close on Wall Street, the stock managed to preserve most of its gains and finished the day at $136.33. The rally comes on the back of the reports that Apple is said to increase Google Cloud spend by 50% this year. The spending totals to $300M, as the company increases the amount of user data stored on the platform. Technically, Apple shares are likely to accelerate the upswing on a sustained break above the $137 mark.
Apple shares gave up some ground on Friday after a pretty solid week. Not too surprising and not too shabby given a nice solid triangle breakout on Tuesday that has set up a nice bullish picture. Now all that is needed is for Apple stock to continue its bullish run and retake the highs at $137 that the shares set just after the release of the last results. Those results it should be noted were not the reason for the precipitous fall to the low $120s. The results beat Wall Street analyst expectations by over 40%, and Apple increased both its dividend and stock buy-back programs. This was not enough to stop the shares sliding though as May was a tough month for the Nasdaq, and some tech names struggled in the face of rising inflation concerns.
That has now been put to one side as the Fed has effectively put the 10-year yield to sleep while at the same time bringing forward talk of rate rises into 2023. No easy task, but markets seem to like the fact that the Fed may not be too far behind the inflation curve. All this helped tech stocks and the Nasdaq recover ground versus the broader market, and AAPL stock has found strong support in the low $120s. This area saw a convergence of strong support factors, the 200-day moving average, and some strong volume from a previous consolidation zone.
-637604732356259982.png)
Apple key statistics
| Market Cap | $2.22 trillion |
| Enterprise Value | $2.1 trillion |
| Price/Earnings (P/E) | 30 |
|
Price/Book | 35 |
| Price/Sales | 8.5 |
| Gross Margin | 40% |
| Net Margin | 23.4% |
| EBITDA | $100 billion |
| Average Wall Street rating and price target | Buy $159 |
Apple stock forecast
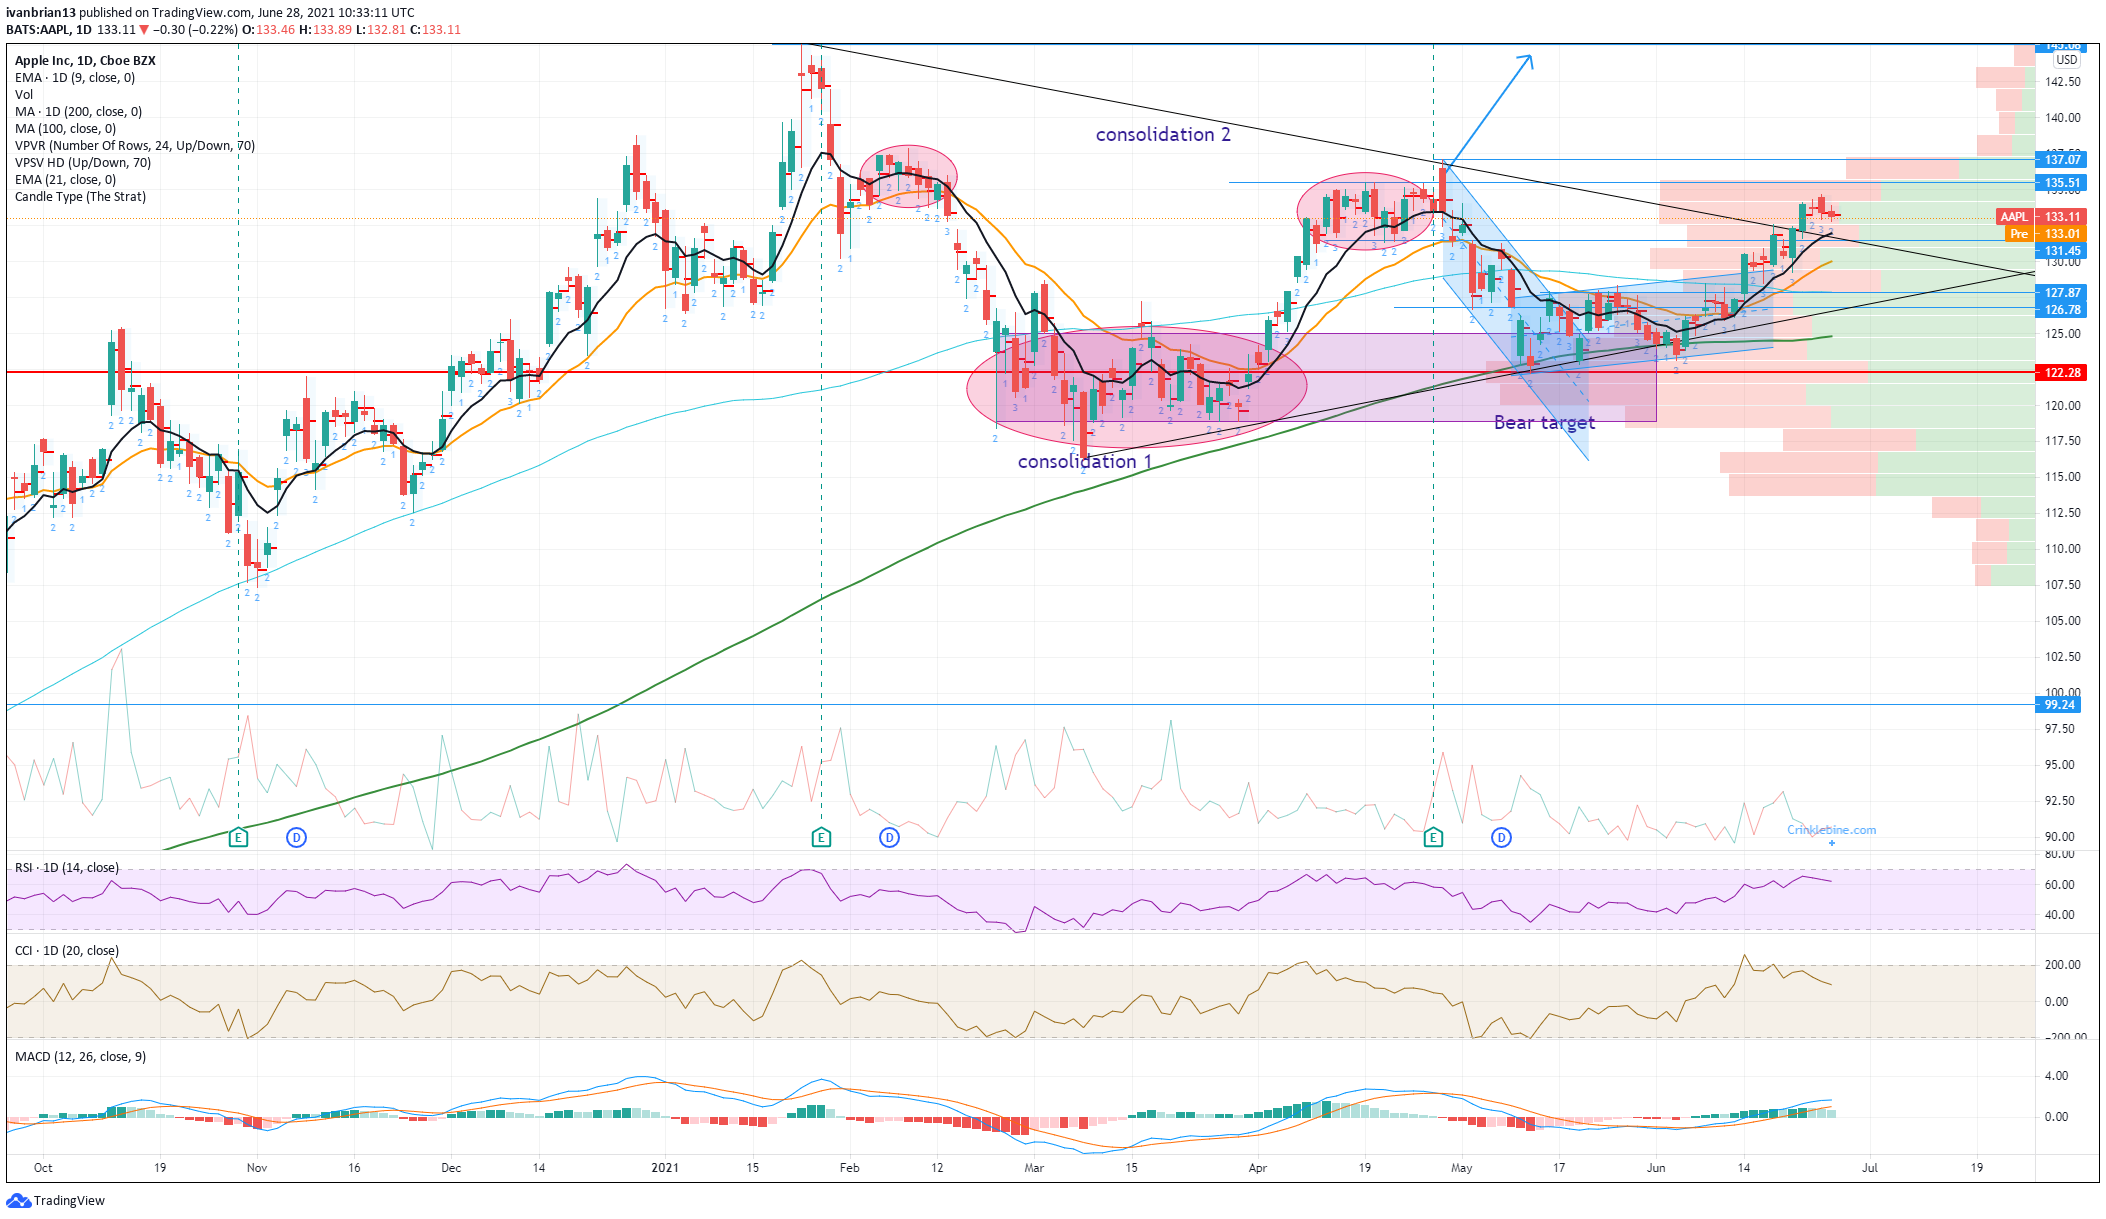
The performance on Thursday and Friday has seen Apple give up some gains from the recent triangle breakout but nothing to get too concerned about. The 9-day moving average is still guiding higher and below the current AAPL stock price. This 9-day moving average and the triangle line intersect at $131.97 to give strong short-term support, key to keeping the trend bullish. All momentum indicators, the Relative Strength Index (RSI) and the Commodity Channel Index, are trending higher in line with price as is the Moving Average Convergence Divergence (MACD). The target is to break the $137 resistance. This is the spike high registered just after that stellar earnings release. Breaking here sees a clear lack of volume on the volume profile chart to the right. So a break should see a quick acceleration to test all-time highs. Given that many other mega tech names have tested or broken all-time highs (Facebook, Amazon and Alphabet), there is no reason for AAPL shares to be lagging behind its peers.
In summary, here are the four major takeaways.
1. Bullish triangle breakout
2. Trending higher, above the 9, 21-day moving average
3. Nasdaq making new highs, peers making or near new highs, Apple to catch up
4. If it breaks $137, it should accelerate the move
Previous updates
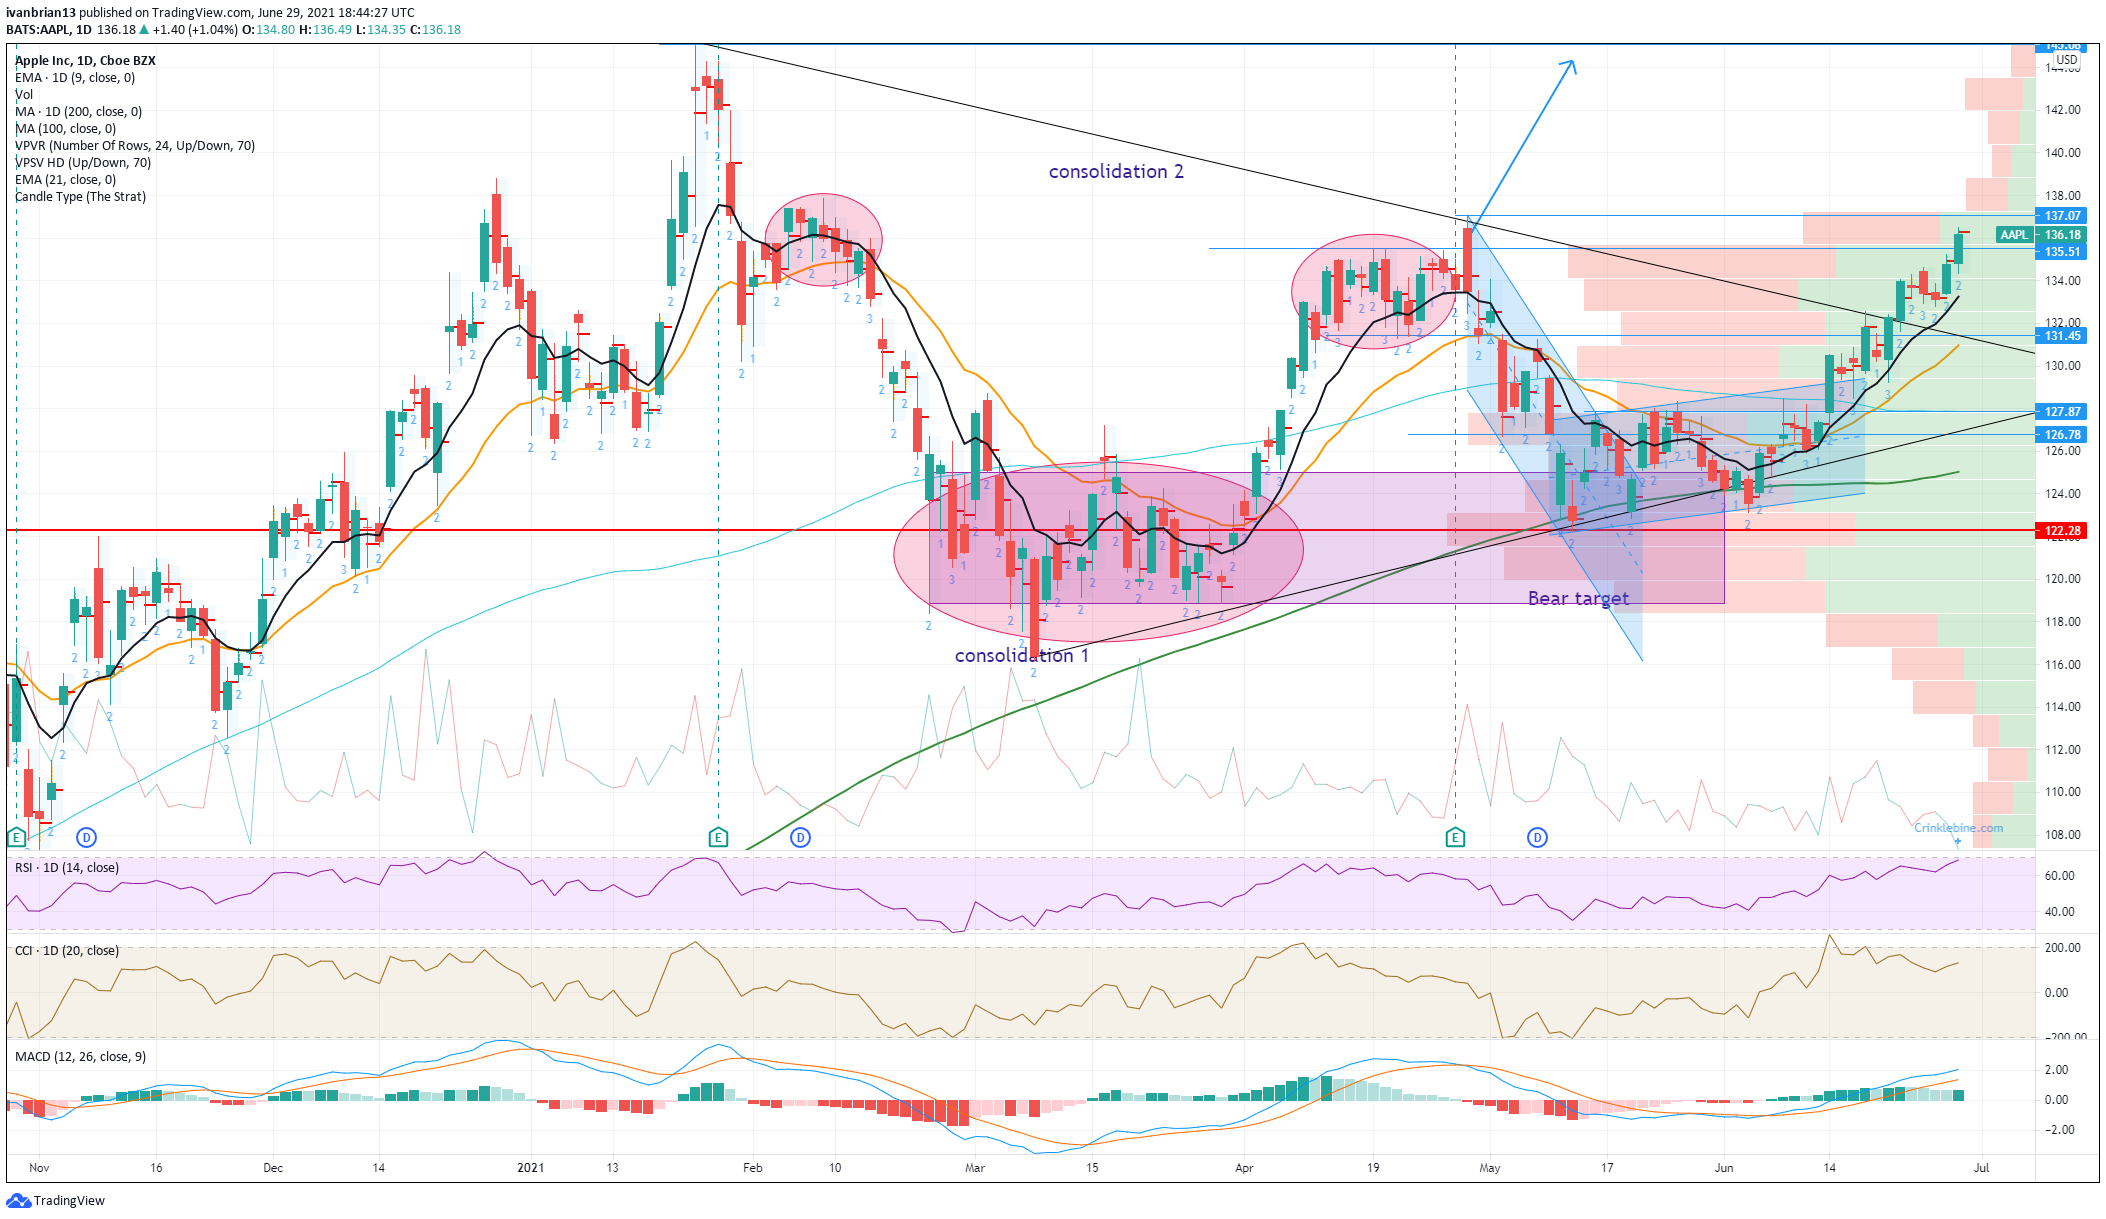
Update June 29: Apple shares are continuing to target a move towards record highs with another solid day of gains. Despite the Nasdaq being flat and both S&P and Dow being slightly in the red Apple stock has remained bullish taking out a small resistance at $135.51. At the time of writing, with just over an hour left in Tuesday's regular session, the stock is trading at $136.17, just under the key $137 level. Above $137 the move should accelerate as the volume profile thins out dramatically.
Update after the close June 28: Another perfect setup on the move higher with a strong continuation candle engulfing the last two sessions. AAPL closes at $134.78 with $135.51 is an interim resistance but the big prize is $137 as a break there should speed things up nicely toward record highs.
Update June 28: So far so good for our three reasons, as AAPL stock pushes 1.4% higher in the first thirty minutes of trading on Monday. In the process, the previous two bearish candles have been extinguished with Monday engulfing the previous two highs. Above $137 volume is thin so the move should extend rapidly to $142. From there it would be rude not to at least test record highs above $145.
Like this article? Help us with some feedback by answering this survey:
Premium
You have reached your limit of 3 free articles for this month.
Start your subscription and get access to all our original articles.
Author

Ivan Brian
FXStreet
Ivan Brian started his career with AIB Bank in corporate finance and then worked for seven years at Baxter. He started as a macro analyst before becoming Head of Research and then CFO.


