3M is the best-performing Dow stock in 2024 so far
- 3M stock is outperforming the other 29 Dow Jones stocks YTD.
- 3M shares fell in value by two-thirds between early 2018 and late 2023.
- Analysts have upgraded 3M now that lawsuits have been settled.
- Weekly chart shows bullish break above five-year resistance trendline.
After years of underperformance, 3M (MMM) is now the best-performing stock in the Dow Jones Industrial Average (DJIA) year to date. By coming to terms with a number of high-profile lawsuits, cutting its dividend for the first time in more than half a century and demonstrating increased profitability in quarterly results in July, 3M stock now appears to be in a technical uptrend for the first time since 2018.
3M stock’s 47% gain this year has led the DJIA to a 10.3% gain so far, although heavier index weightings for Goldman Sachs (GS) and American Express (AXP) have played an outsized role. Despite broad market turbulence at the beginning of August, the DJIA reached an all-time high last week.
3M stock news
3M has performed so well in 2024 due to its recovery from a historic multiyear sell-off. MMM shares cascaded off all-time highs above $217 at the start of 2018 to a decade-long low of $71.35 in October 2023.
A great weight has been lifted off the shoulders of 3M shareholders this year as management was finally able to agree to terms with plaintiffs regarding defective combat earplugs and PFAS chemicals in drinking water — the latter of which are often termed “forever chemicals”.
After 65 years of increasing its dividends, 3M management bit the bullet and cut its quarterly payout from $1.25 to $0.70 per share earlier this year in order to fund its settlements. In June the company agreed to pay over $10 billion over a 13-year period to settle lawsuits with US municipal water utilities over PFAS cleanup.
The recent rally was aided by a 15% consensus beat on second-quarter EPS in late July coupled with a $426 million upside surprise to revenue.
Analysts quickly piled on with upgrades to MMM. Deutsche Bank raised its outlook to Buy and boosted its price target from $100 to $150. Bank analysts said they had confidence in the growth strategy of new CEO Bill Brown.
“We look for growth to continue in 2025, as the company benefits from cost reductions, and are boosting our preliminary adjusted EPS estimate to $7.65 from $7.50”, wrote Argus analyst John Eade at the time.
In mid-August BMO Capital Markets added 3M to its list of high-quality stocks with plentiful cash on the balance sheet, above-average return on equity and low earnings growth volatility.
3M stock forecast
Not many observers have noticed that 3M stock has now clearly taken out a significant five-year resistance point. Since the January 2018 all-time high, this trendline has been descending with fury. But August saw the first break above that trendline, which should give traders confidence that the current rally will have legs.
3M is likely to reach the $150s at the very least this year. Many analysts view this region, where there is prior support, as a short-term price target. However, the $170 price level seems like a good bet as well. That is where a brief recovery found resistance on the way down in the summer of 2021.
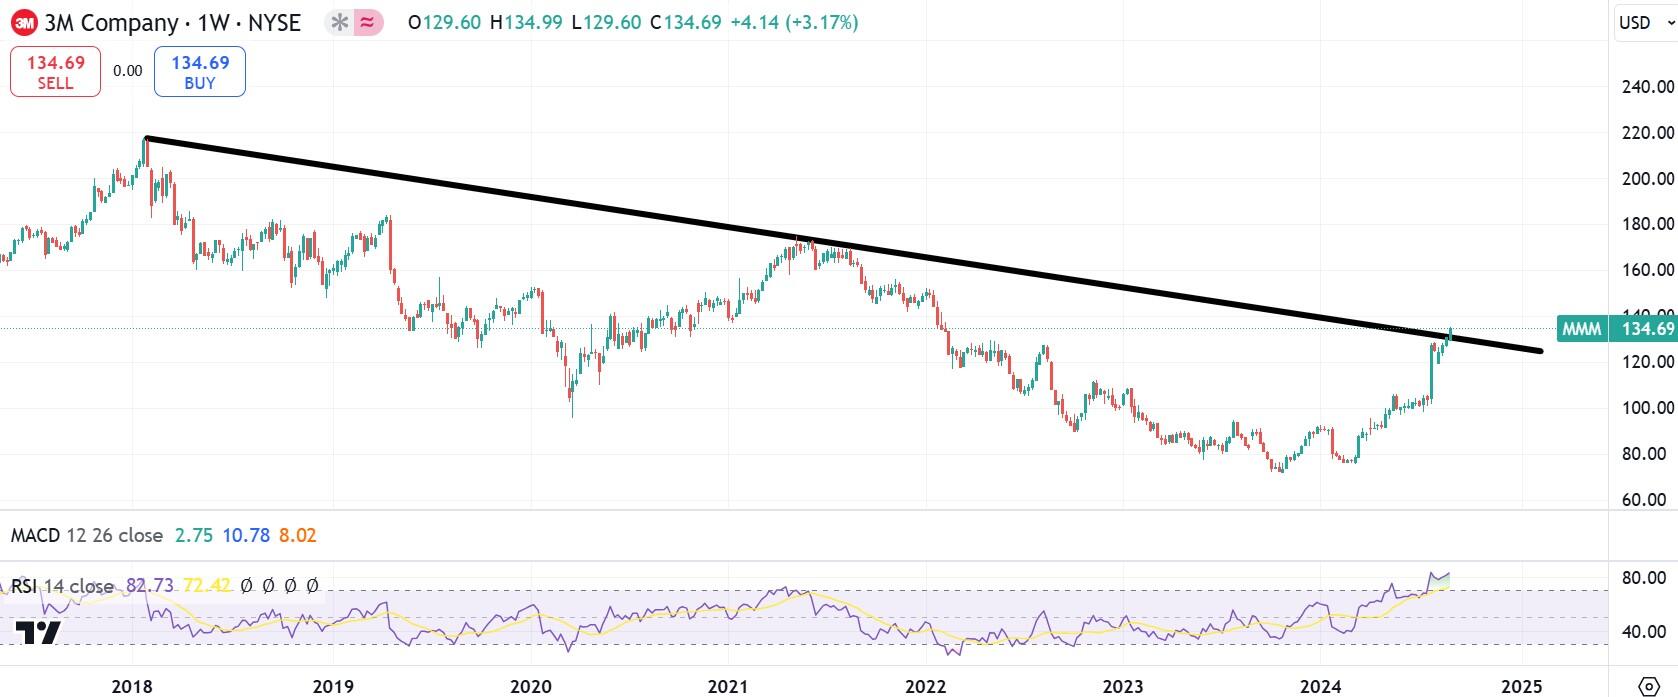
MMM weekly stock chart
The daily chart below gives us some idea of support points. The August 5 marketwide sell-off stopped just below $120, and the 50-day Simple Moving Average (SMA) glides above $115.50. The swift rally this year will need some period of consolidation before higher support levels become evident.
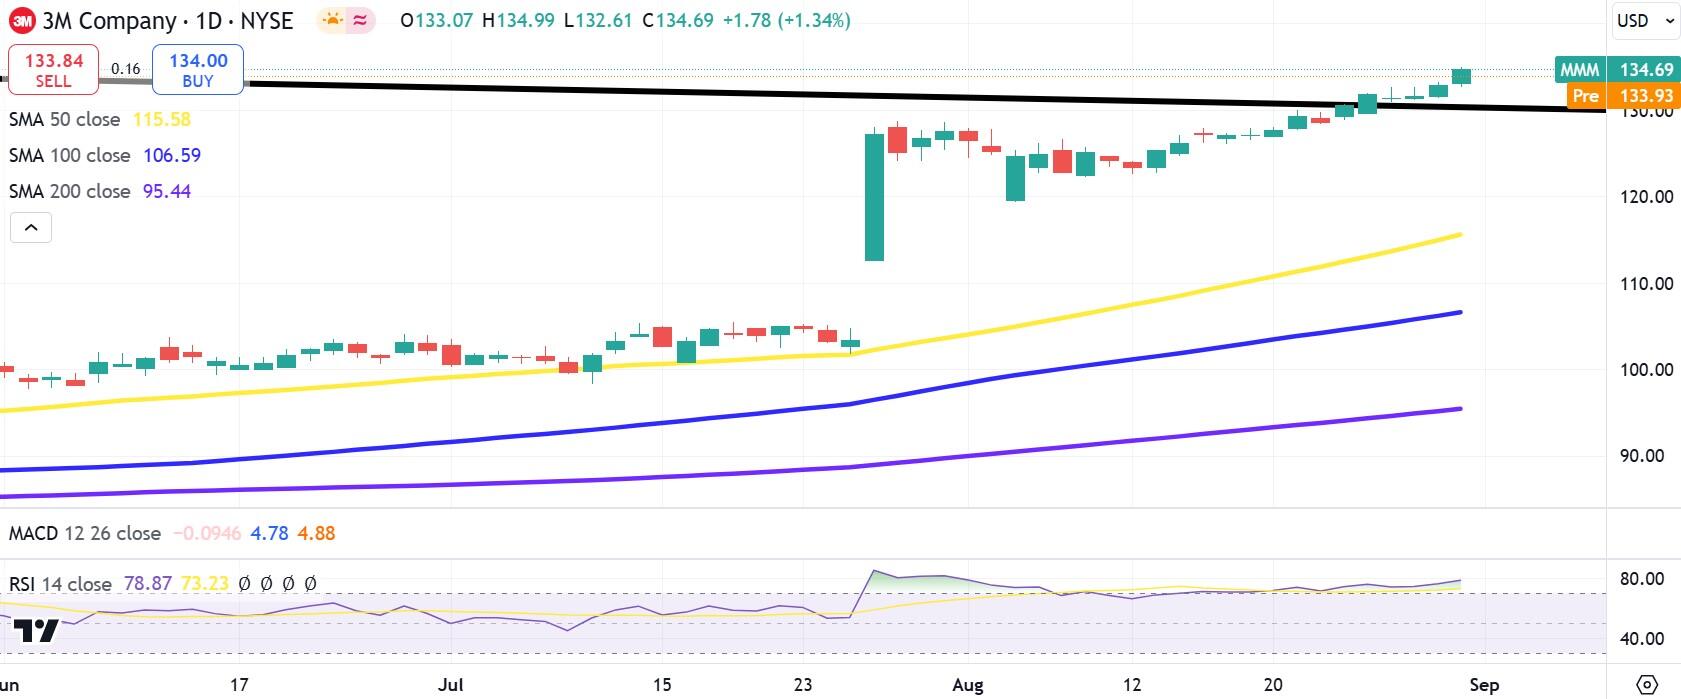
MMM daily stock chart
Premium
You have reached your limit of 3 free articles for this month.
Start your subscription and get access to all our original articles.
Author

Clay Webster
FXStreet
Clay Webster grew up in the US outside Buffalo, New York and Lancaster, Pennsylvania. He began investing after college following the 2008 financial crisis.


