![]() Brandon Wendell, CMT
Brandon Wendell, CMT
Brandon Wendell
Investors suffered through a frantic and volatile 2018 in the markets and the big question on many minds is, ‘Why is the stock market down and will it continue the spiraling downward trend or make a come back?’ What you need to know is that the financial markets are a forward-looking mechanism. Professional investors and institutions will buy and sell stocks due to what they believe the global and U.S. economy will be doing in the future, not the current news.
What Caused the Market Selloff?
We are currently amid earning’s reports that are less than expected, and forecasts for revenues for the upcoming year seem dismal. Stock market leaders like Morgan Stanley, Nvidia, Caterpillar, Amazon and Alphabet are not meeting the expectations set by the street and investors are selling off as a result. The professionals, however, anticipated deflated reports being release and began to act last year. Their stock selloff caused the wild gyrations of prices in 2018 as the market balanced the smart money exiting early as exuberant investors piled in for fear of missing out on all-time highs.
The smart institutional money investors and traders properly predicted the limited impact of the tax cuts to the bottom line of major corporations, while investors were duped into thinking that the stimulus would be groundbreaking and immediate in effect. Adding to the misery of earnings is the effect of the trade war and tariffs on many imported goods that are needed for manufacturing and sales to increase balance sheets.
On a broad economic scale, there are several major markets that are related to each other and they historically move in cycles. This means a selloff in one of these markets coincides with strengthening in another. We should look at these cycles for information and timing on when and where to place our money. The major assets and cycles to watch, in order, are: the bond markets, the equity markets and the commodity markets.
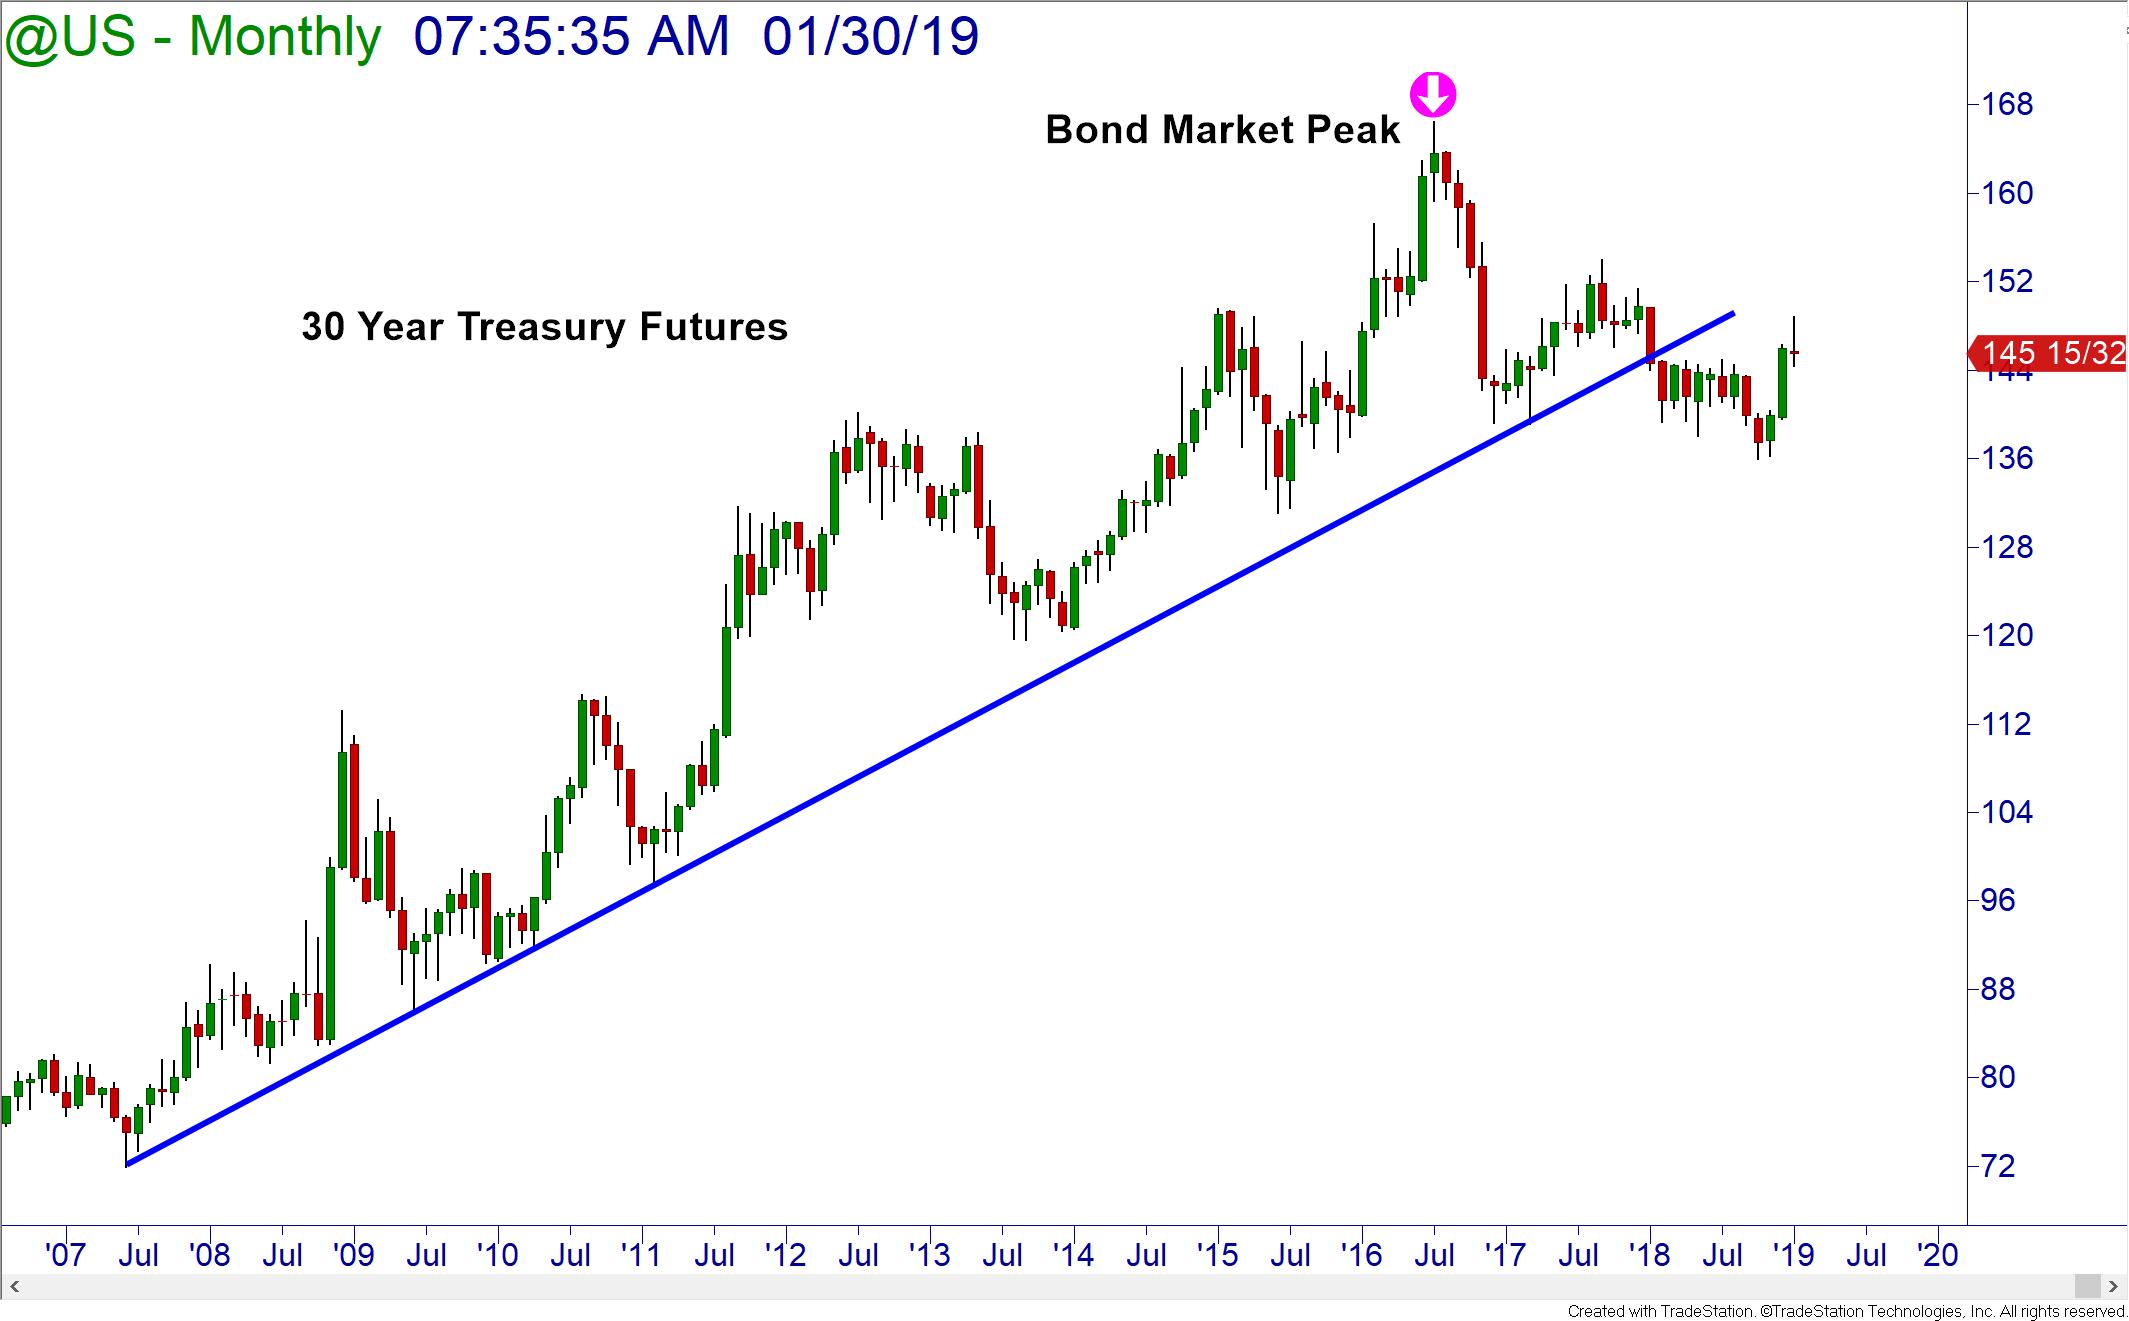
For the bond markets, we should focus on the prices of bonds as well as the interest rates of those bonds. The bond market was pushed into a bull market in 2009 due to the Federal Reserve’s Quantitative Easing Program. In order to stimulate the economy after the 2008 Mortgage Meltdown, the Federal Reserve began to buy as much as $85 billion of US Treasuries per month! The great demand for these bonds drove the bond prices higher and subsequently dropped interest rates to zero. (Bond prices and interest rates have an inverse relationship.)
An additional effect of the purchasing of these bonds was that the economy was flooded with more US Dollars and, therefore, the value dropped. This makes debt easier to pay, exports cheaper and stimulates the economy, in theory.
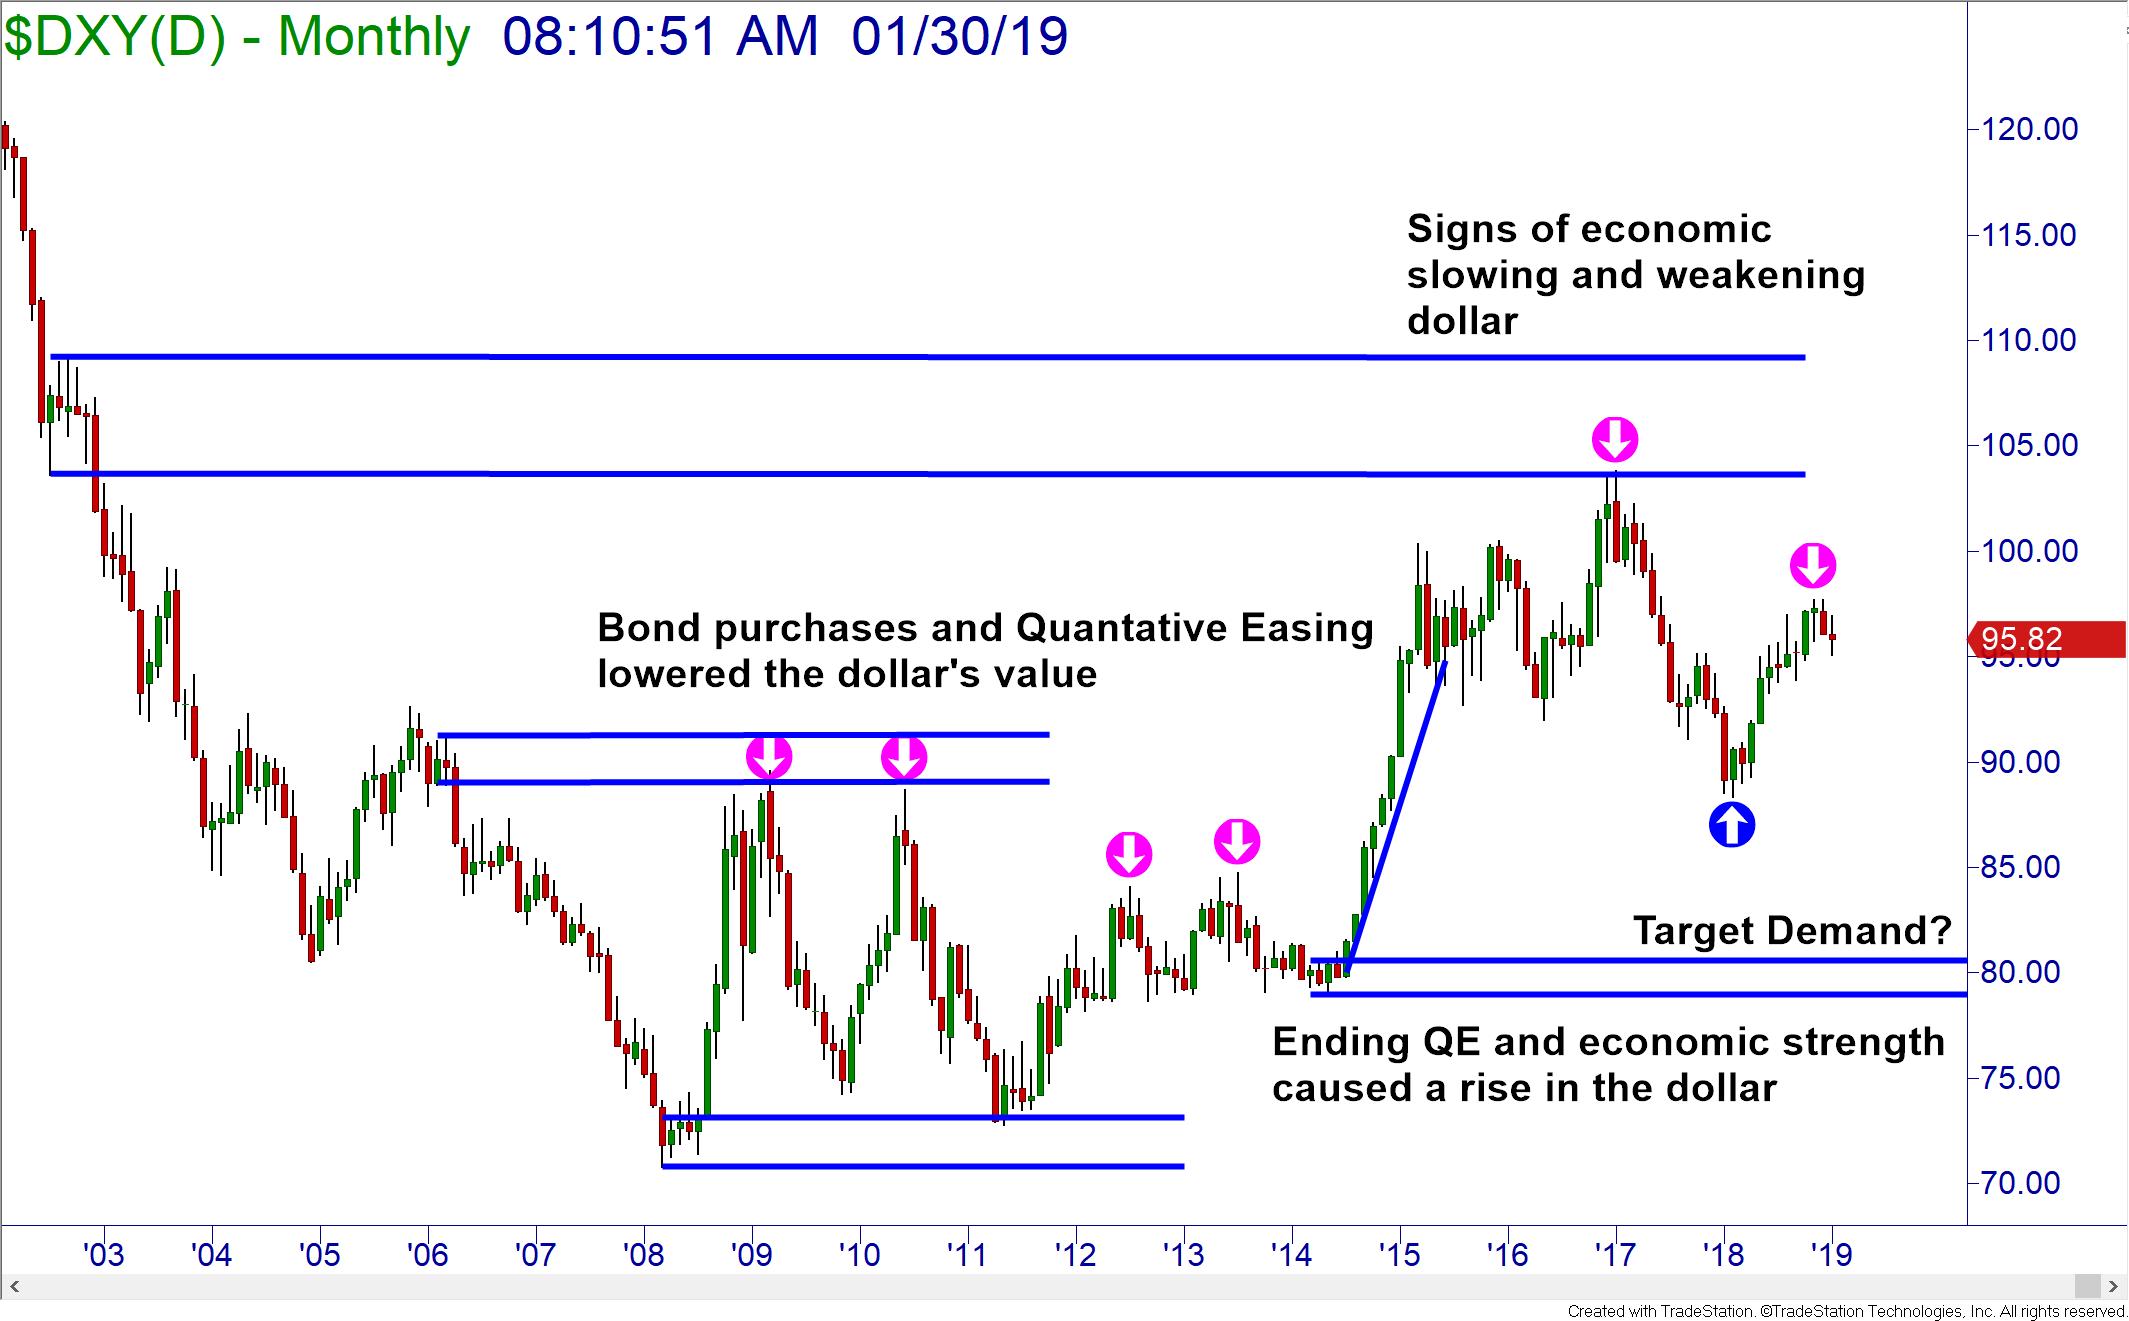
The Quantitative Easing Program ended in 2014 after many rounds; however, the bond market continued to climb as investors and institutions bought late into the bond bubble in both Government and Corporate debt. The bonds finally peaked in June 2016, ending the bullish cycle. This coincided with the Federal Reserve’s decision to begin raising rates to stem inflation and return the rates to a normal economic number.
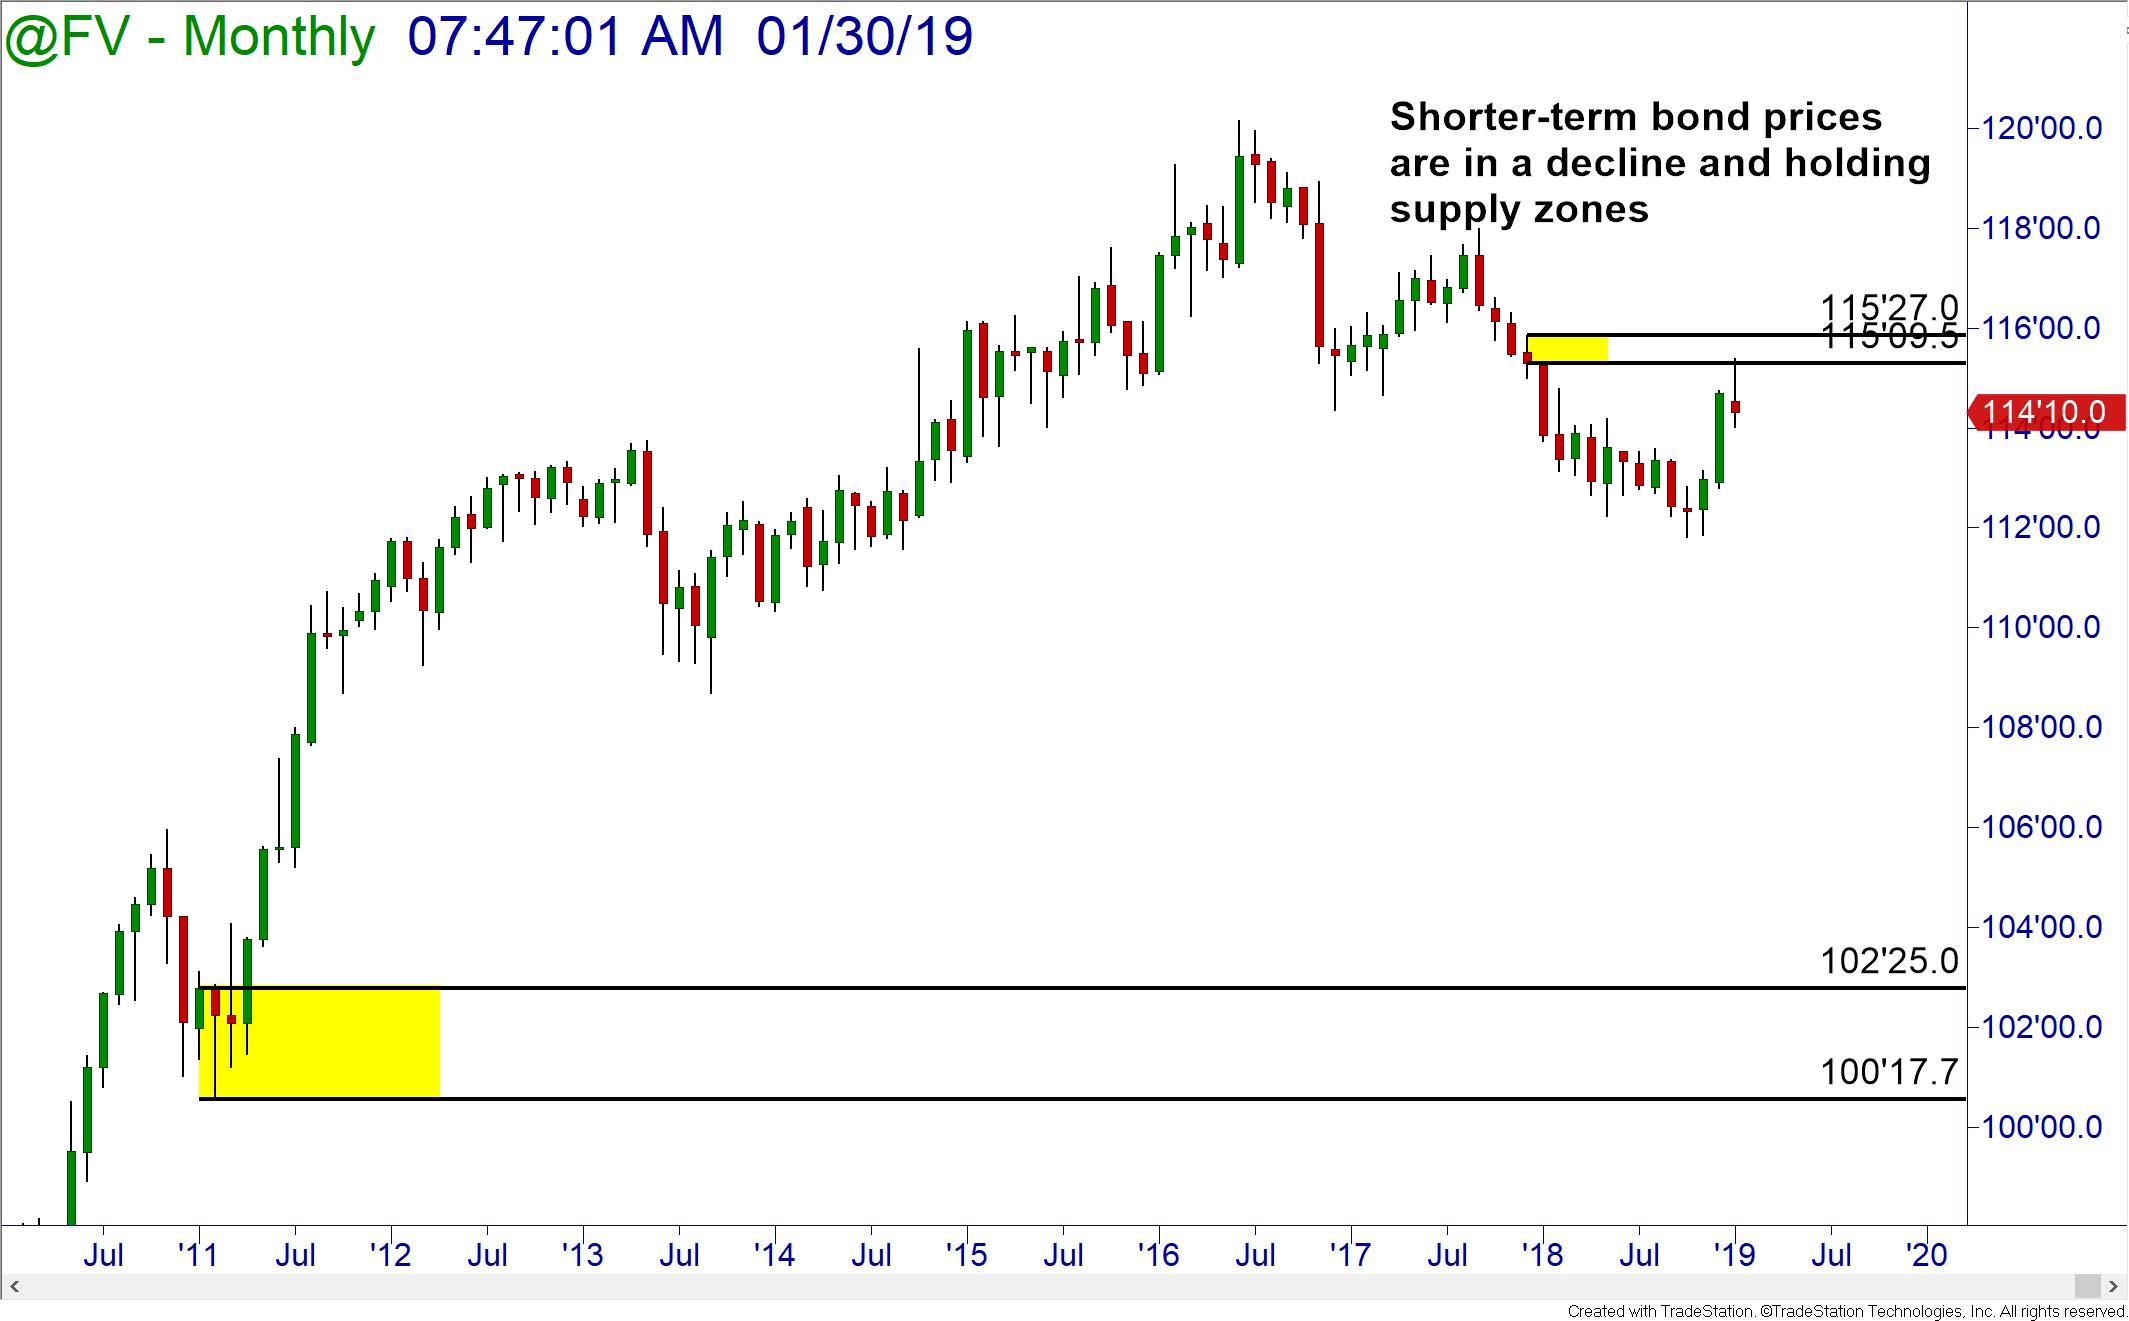
Without the large demand from the government driving bond prices higher, there was little incentive for the market to continue to climb and, so, some market selloff began. In 2017, the Federal Reserve began to sell their Treasury holdings to normalize their balance sheet. This started the decline of the bond market. The price decline continued when the Fed began raising interest rates in 2018.
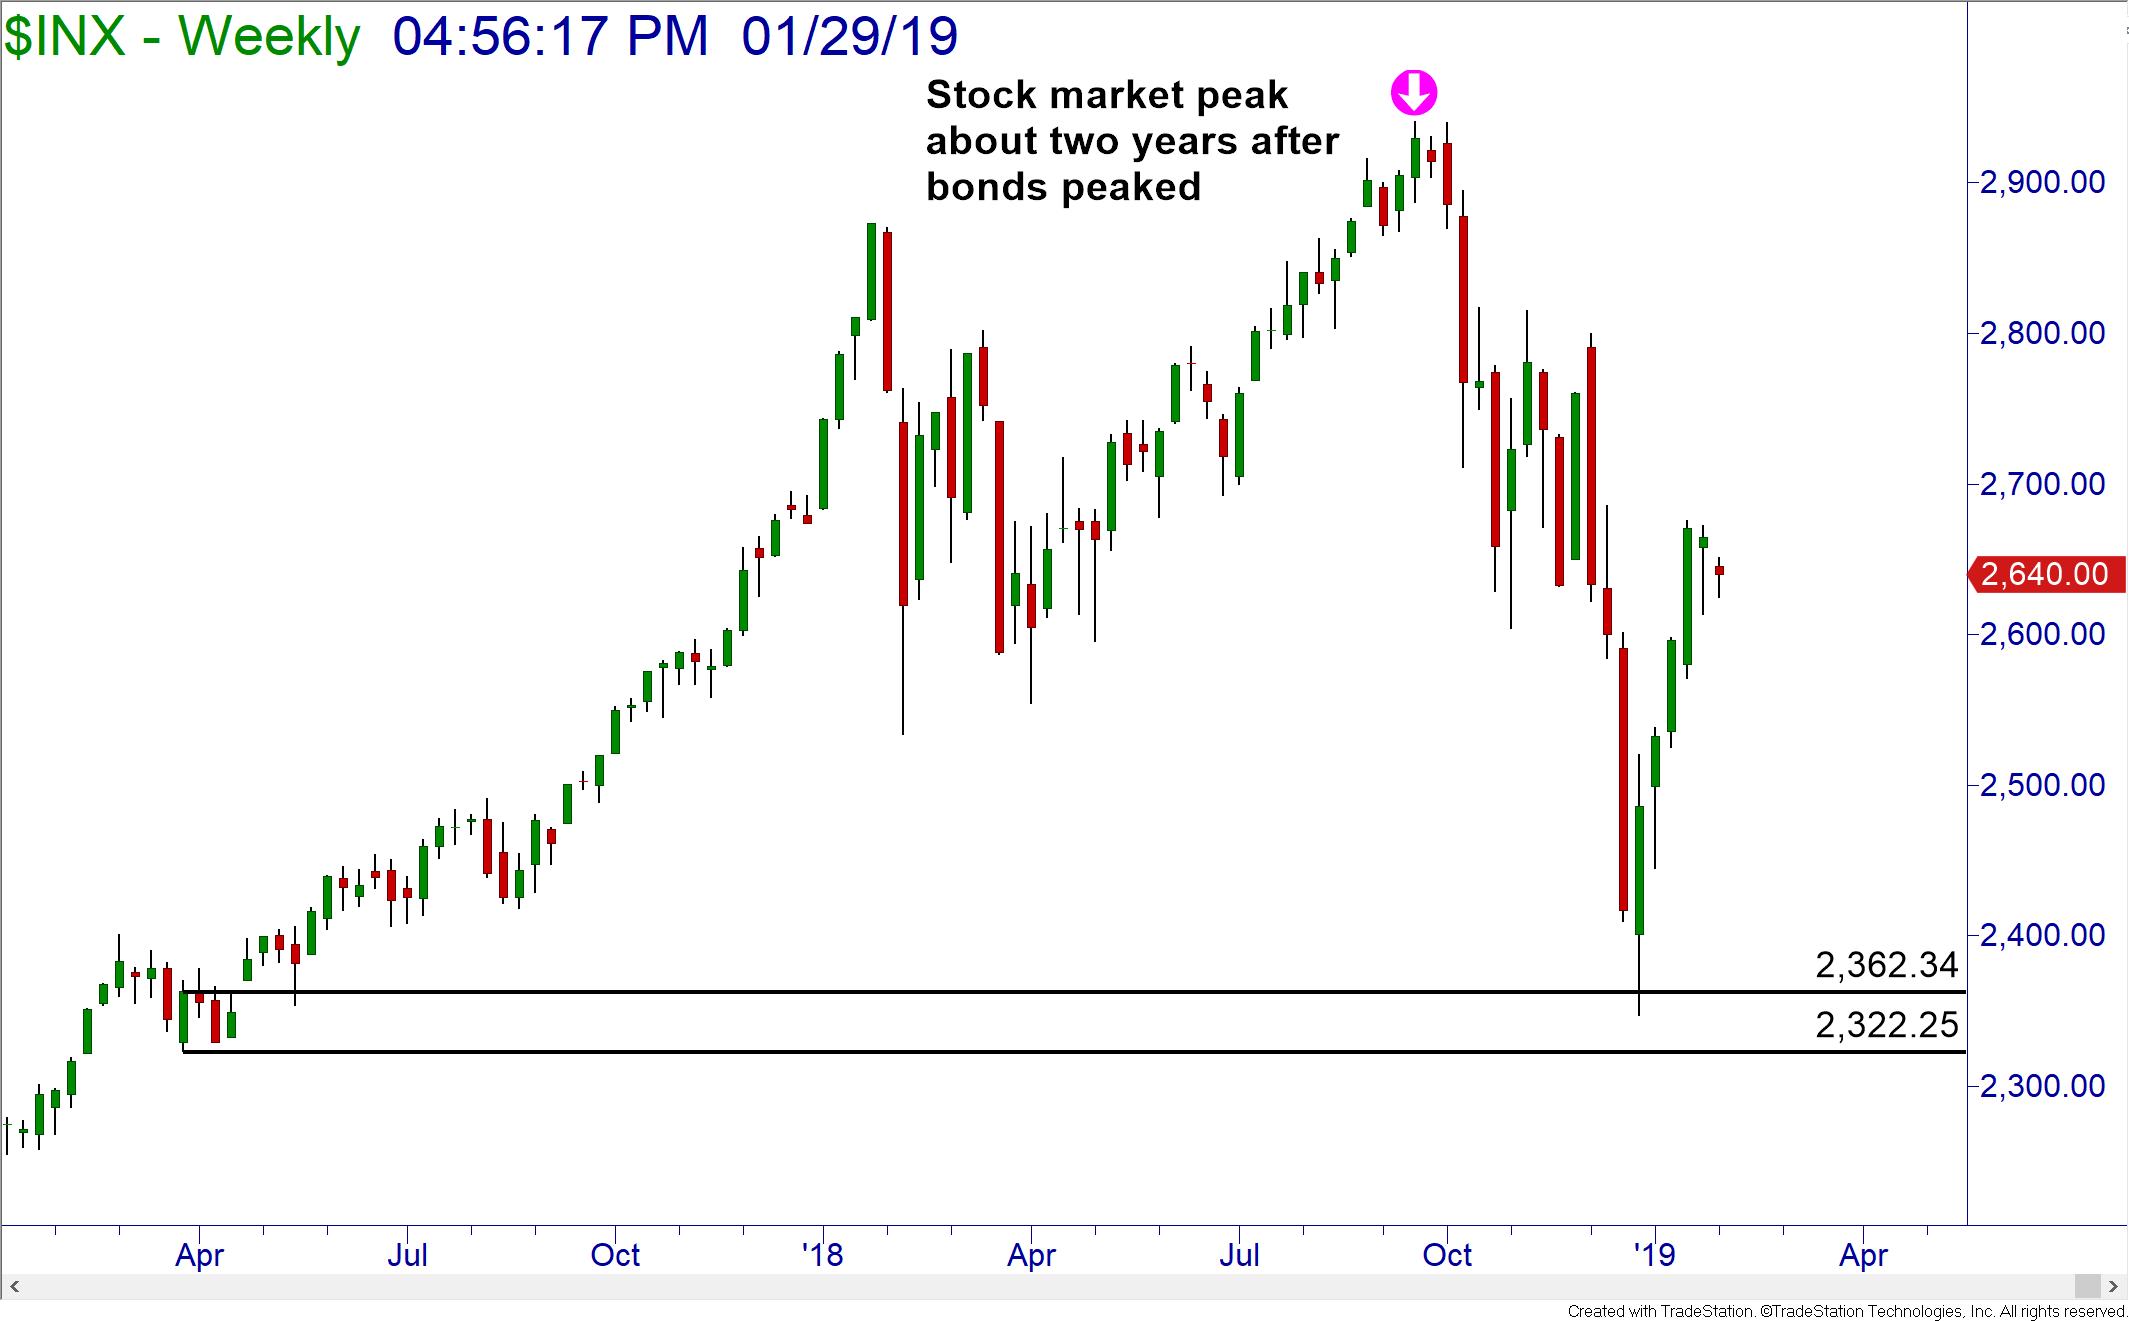
Watching the bond market is important for the stock investor. Historically, the bond price peak is approximately two years before the peak of the stock market. We saw this happen before when bonds peaked in June 2005, preceding the October 2007 stock market high and subsequent market crash. So, with bonds peaking in June 2016, the stage was set for the stock market high and decline to begin in Fall 2018. True to form, the major stock market indexes saw their high in September 2018!
There are many individual signals in the stock market itself that also warned of the weakness: price action, sector rotation, and other topics that I have covered in previous writings. Online Trading Academy also covers this extensively in our courses and special online sessions for students, (XLT General Sessions, Hour with the Pros, etc.).
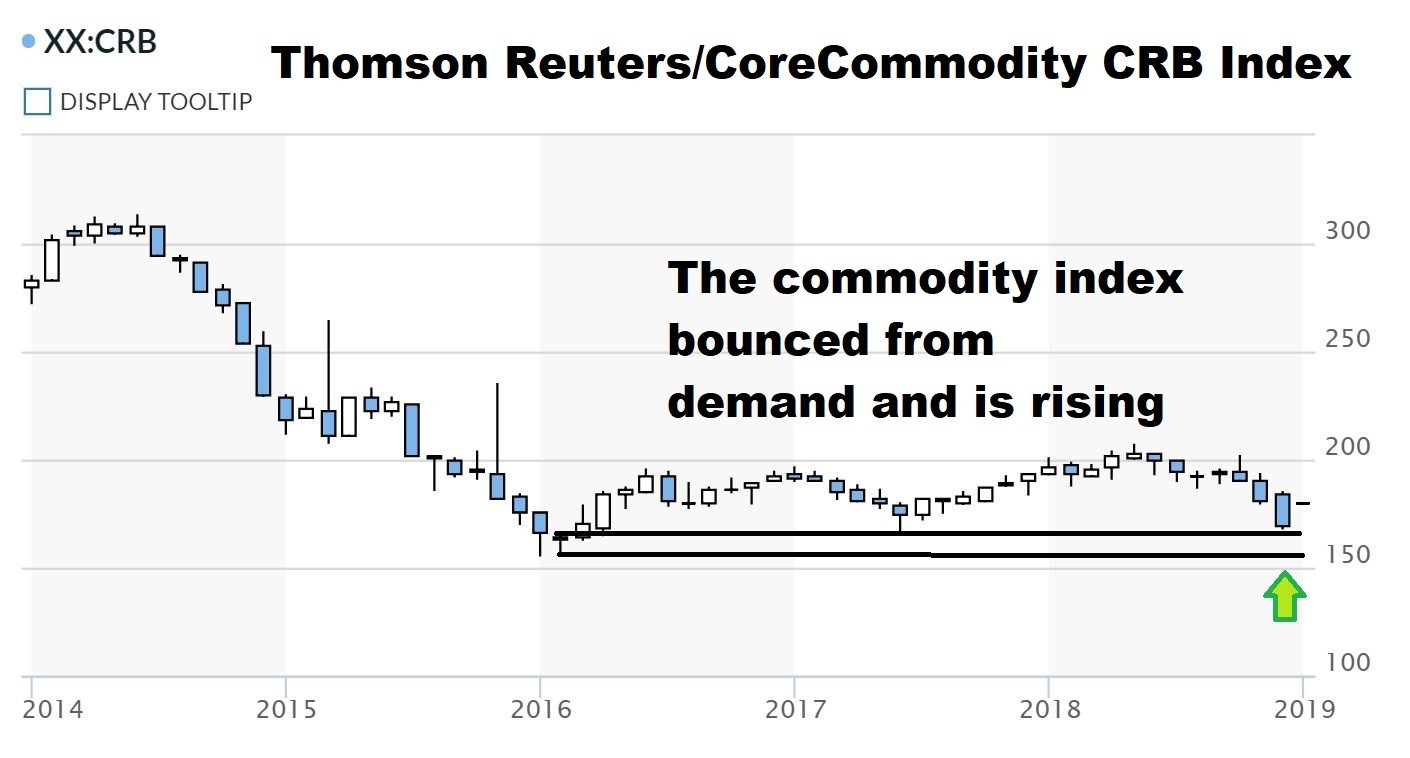
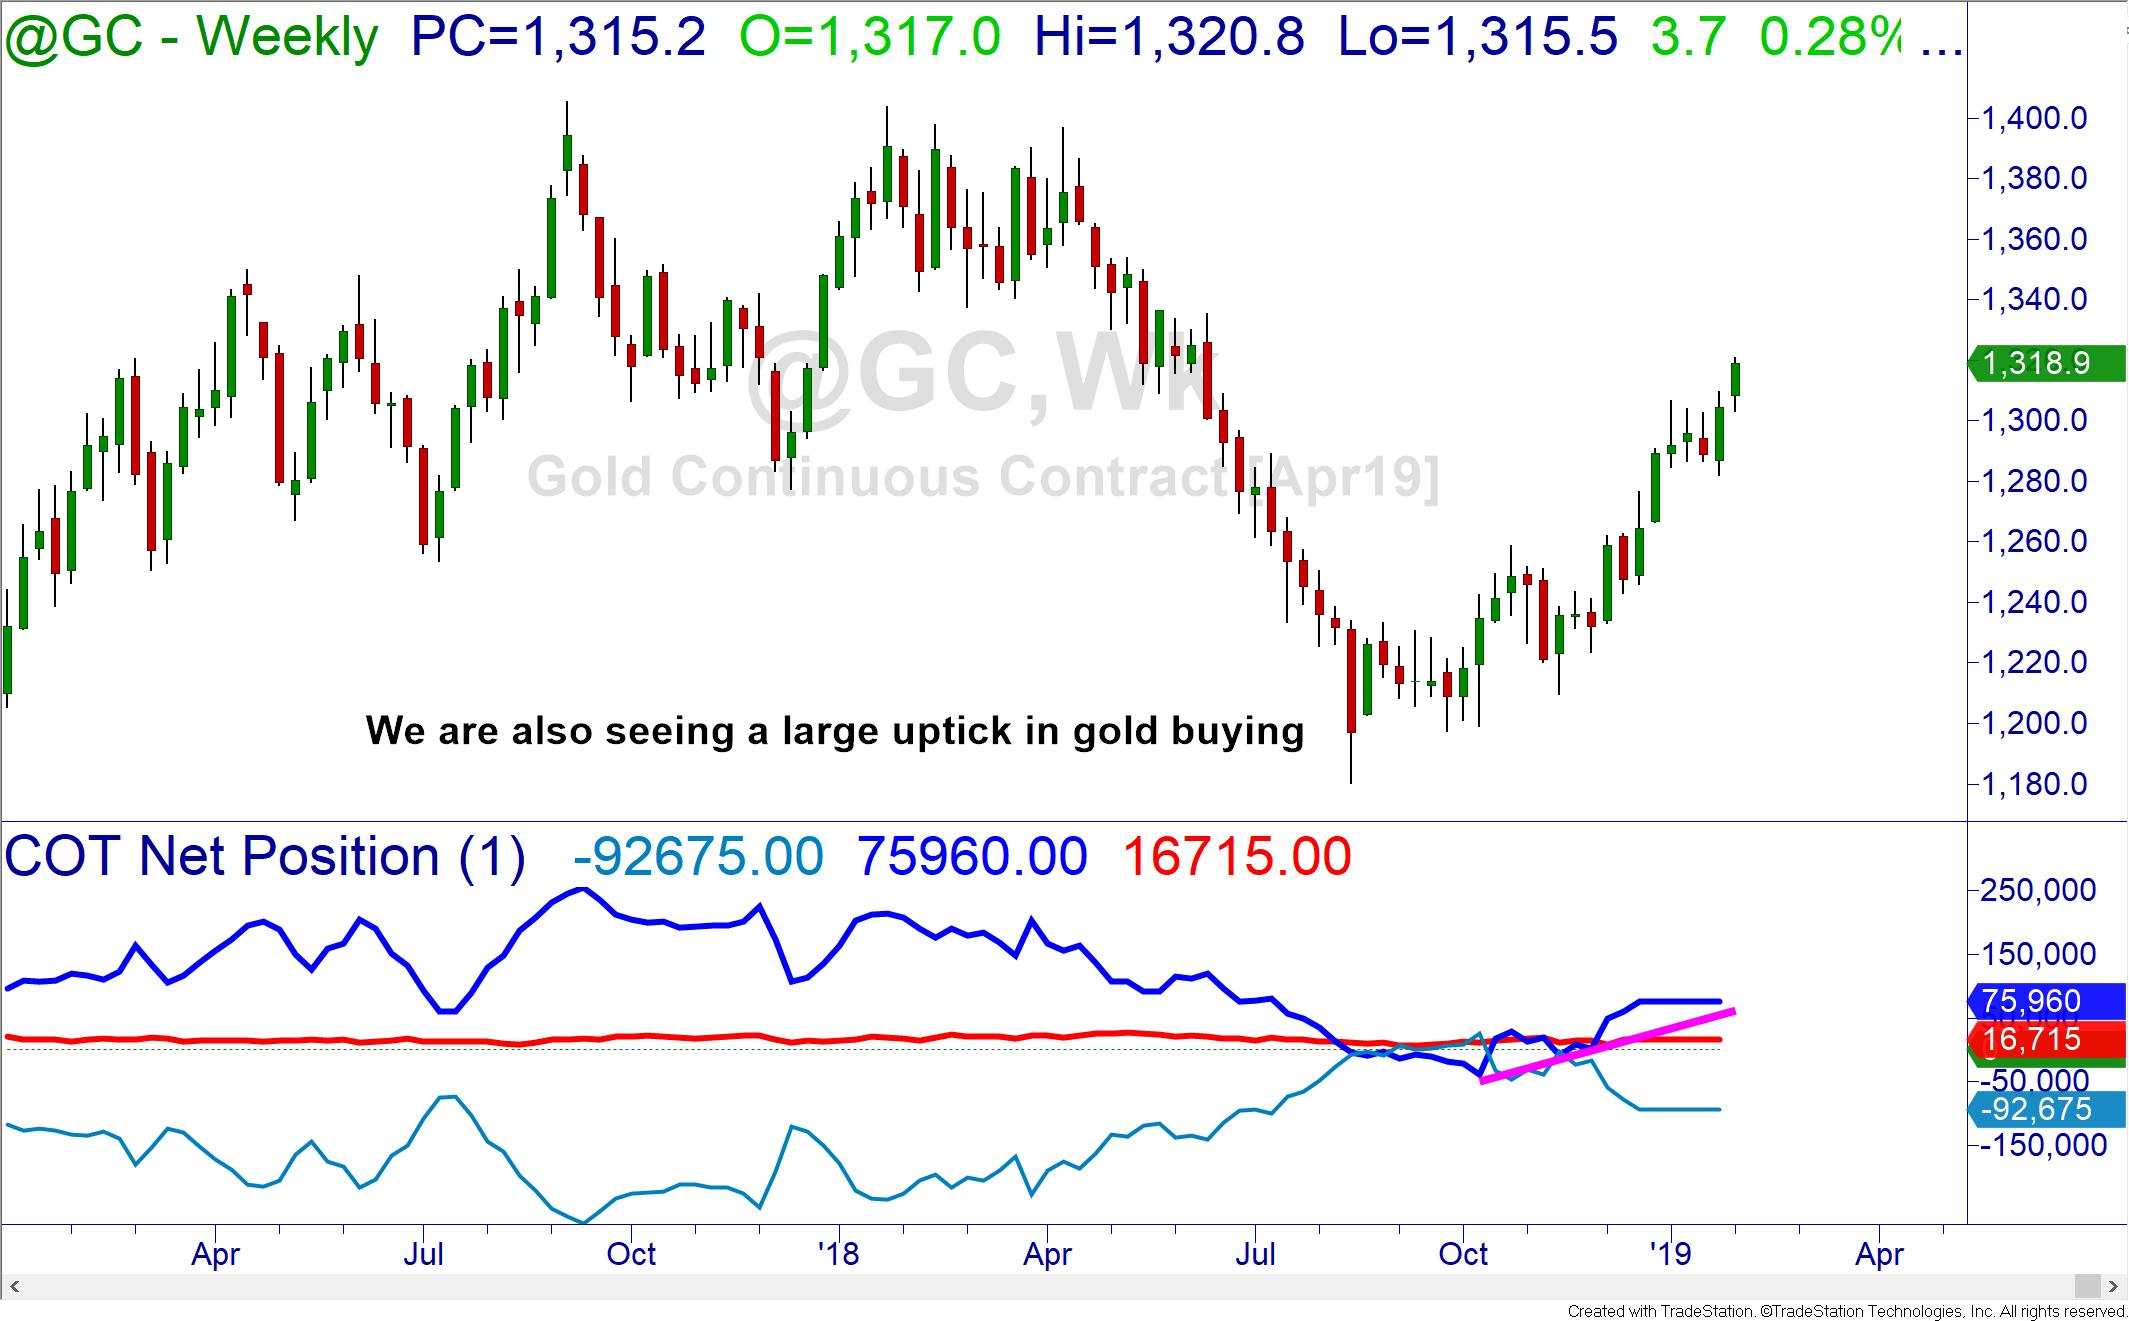
Now let’s talk about the commodities market. During the collapse of the bonds and weakening of the stock markets, there is a flight to safety and a move to hedge portfolios against inflation. The purchase of gold and other related commodities offset the dropping value and purchasing power of the US Dollar. In July 2008, the commodity index peaked just after the stock market and prior to the announcement of the recession. We have recently seen a rise in the commodity index from demand zones which tracks with the emergence of a down market.
Is it a Market Correction or a Crash?
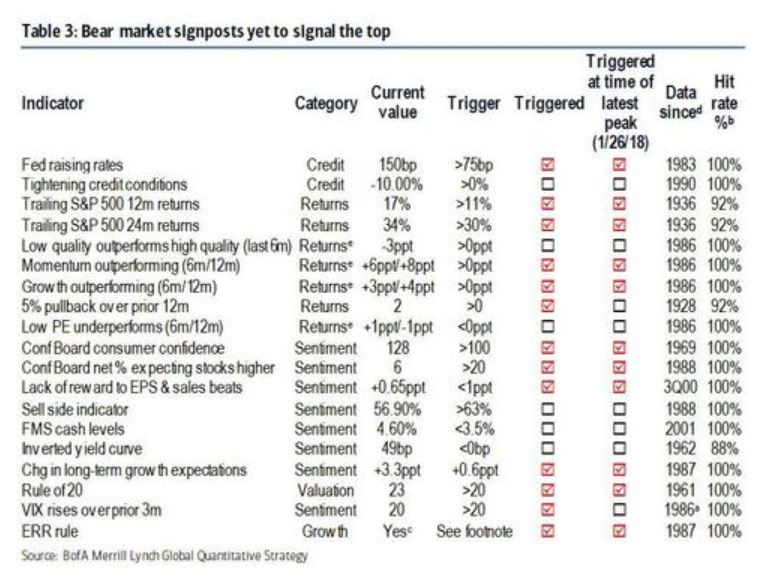
It is difficult for investors and professionals alike to tell whether the market turndowns are a simple hiccup, a larger correction or a market crash. Looking to the past at events that happened before previous crashes is very helpful here. Bank of America Merrill Lynch had been using a checklist that has been eerily accurate for many years. Last Spring, there were thirteen out of nineteen boxes checked foretelling of a nearly guaranteed bear market. Since the list was published, a few more of those boxes got a check mark!
We’ve already mentioned several contributing factors as to why the market is down and why the expectation is that it will continue to be down, but how do things look on the technical side of the market? There are several warning signs there as well.
When markets trade well below their previous averages, this is a cause for concern. One moving average that had been extremely on point for predicting lower prices is the 13-month exponential moving average. Whenever the S&P 500 closes below this average on a monthly basis, lower prices always followed before any new highs were made.

The lower price move took us to the next level of demand. As you can see, there is a demand zone located at approximately a 25% retracement from the all-time highs in the market. Should we experience a typical bear market crash of 50%, that would simply take price to another demand zone.
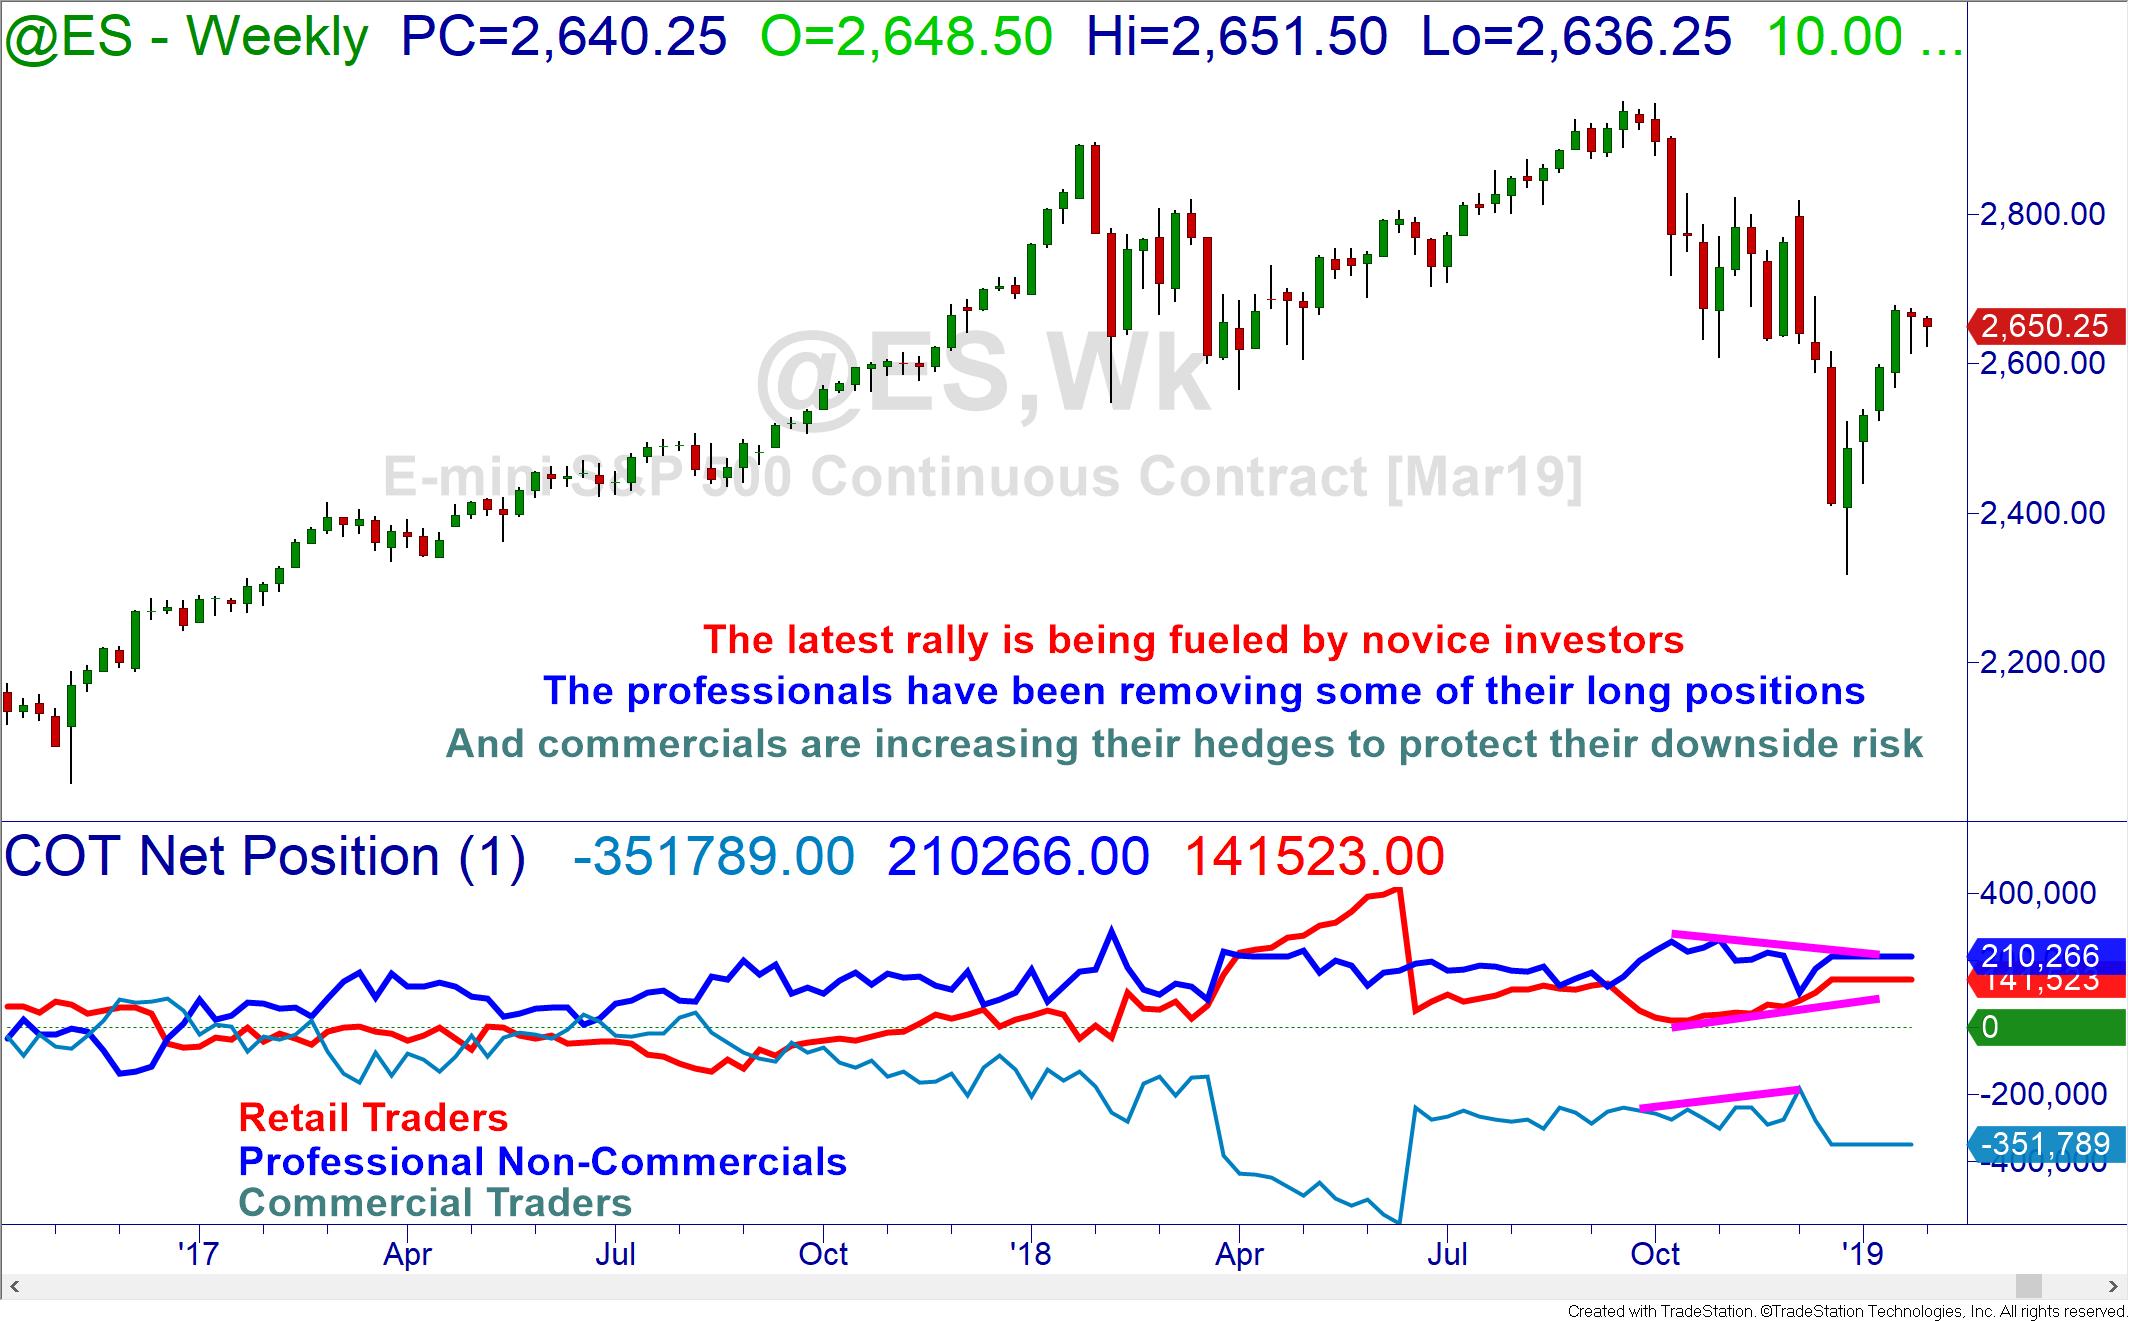
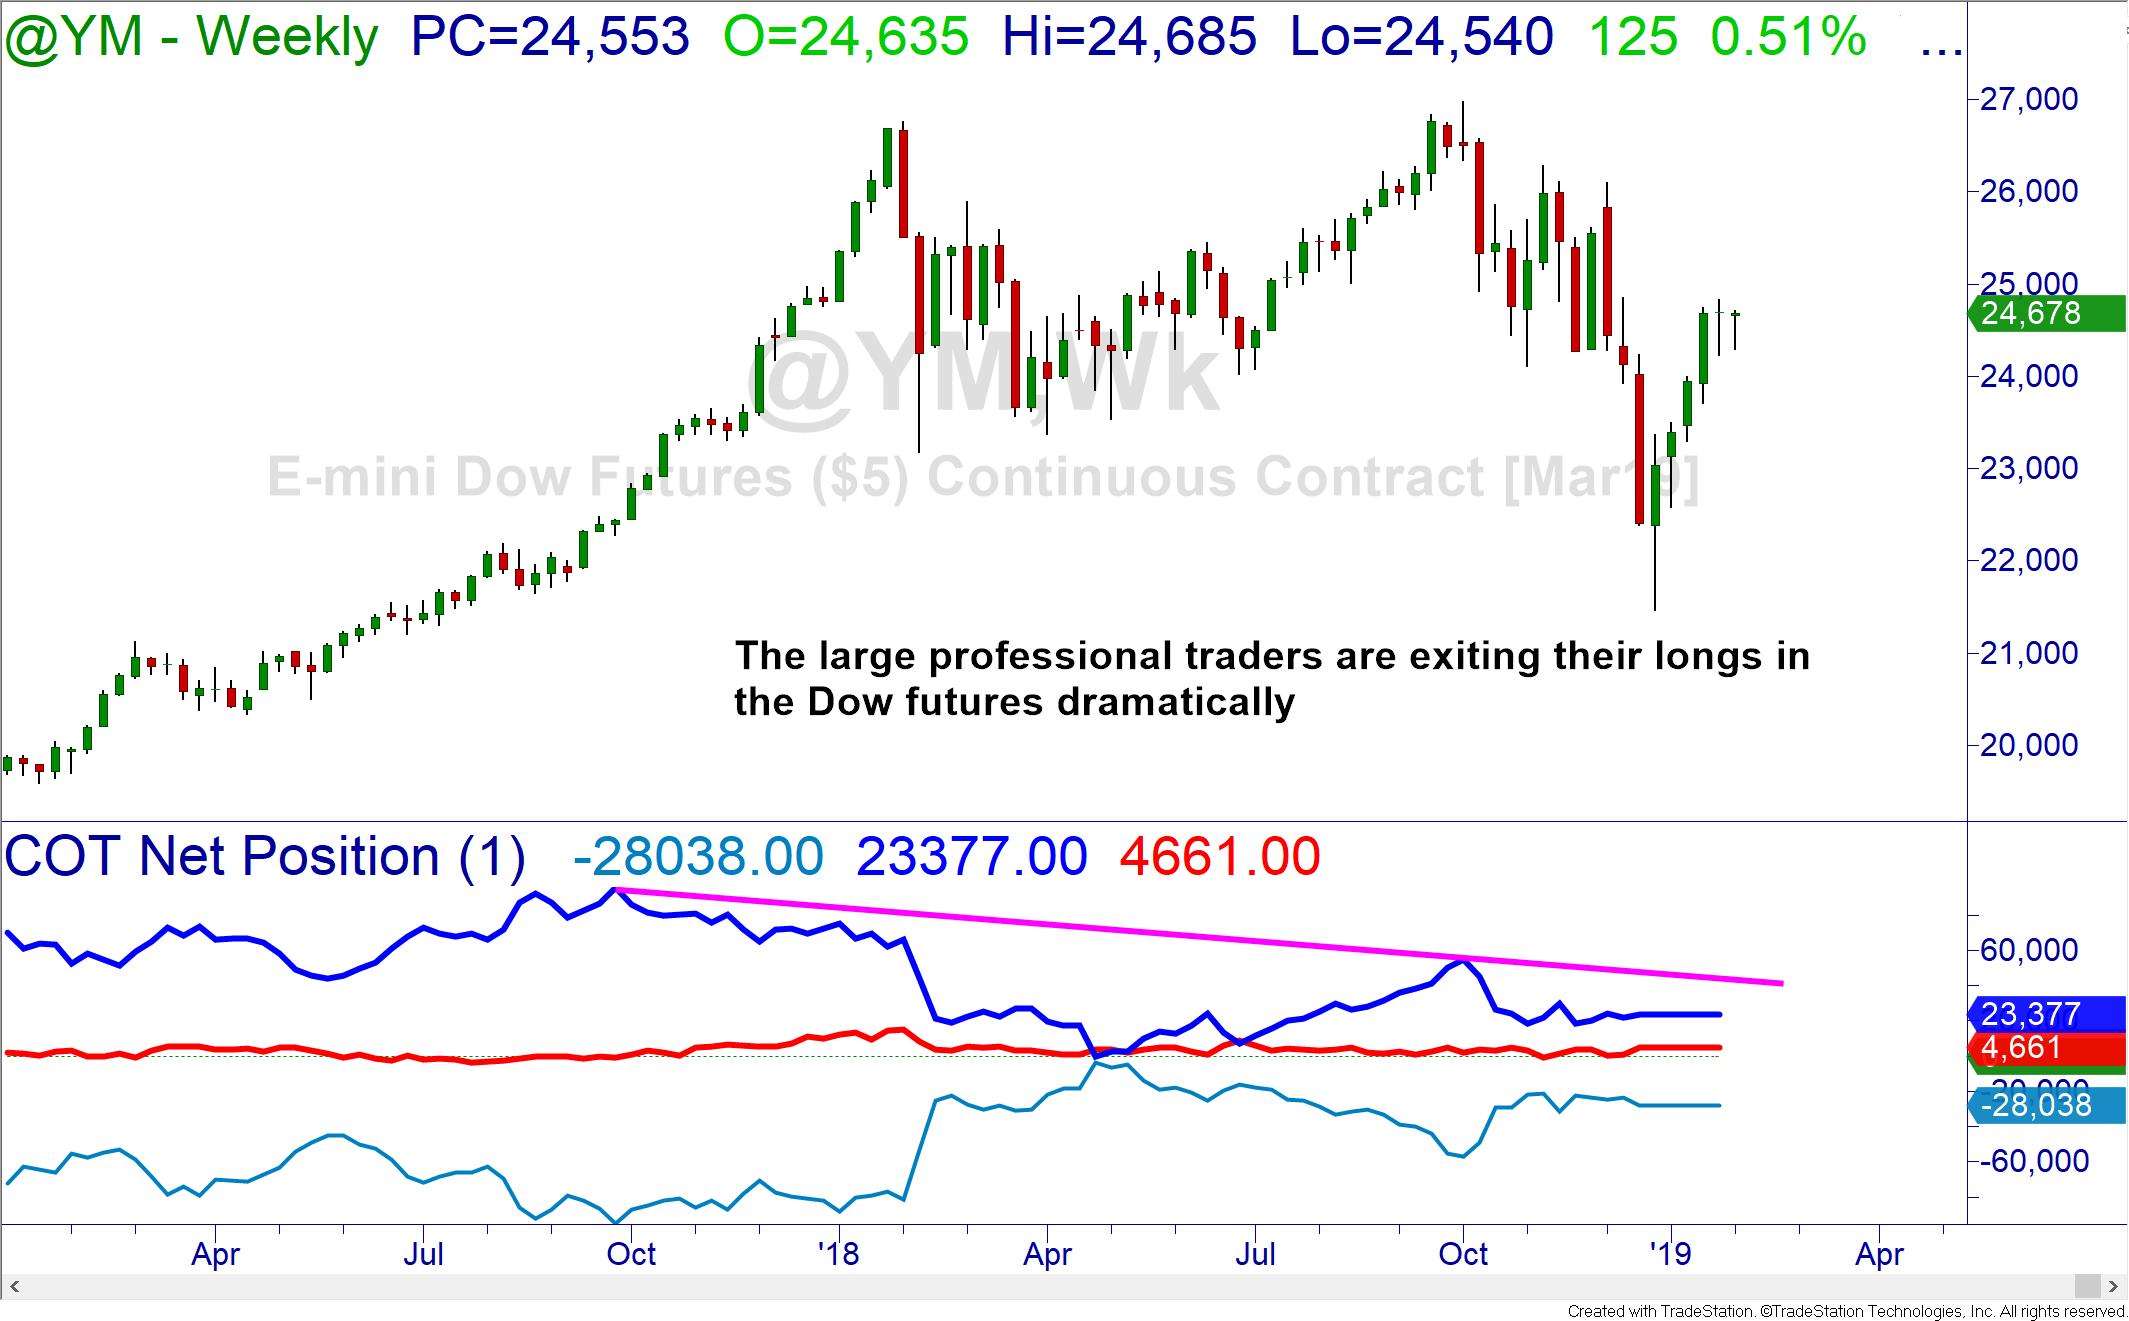
More evidence of market weakness is a lack of participation from major institutions after their big entrance into the markets. While they are not actively short as in 2007-2008, they are being cautions in paring their exposure to the equity markets and we are even seeing an uptick in the purchase of gold futures which supports the rotation to the next cycle.
An issue that could exacerbate the move to the downside in the equity markets is the participation of the major financial institutions in the US. After the mortgage meltdown, the Volcker Rule and the Dodd-Frank Act were put into place to regulate banking and investing and help to prevent a repeat of 2008 or, worse, the 1930’s Great Depression. In 2018, Congress relaxed and even exempted many institutions from these rules. This allowed much investment into the already ballooning stock markets.
Just like in 1929, before the Glass-Steagall Act protected bank deposits from being placed into highly speculative markets, we have now removed the restrictions from the banks and institutions and allowed them free reign to invest and trade freely. With many algorithms doing their trading, more drops in price could trigger great selloffs like we experienced already in 2008 and easily drive the markets down to those demand zones. Should these banks fail to exit in time due to their large positions, the United States could face another banking crisis much larger than 2008 and akin to the 1930s!
The interesting thing is that this is not necessarily to be feared. Instead, there will be great opportunity for the knowledgeable investor. You, as an individual, can protect your investments in a market crash and even create wealth during this period. It takes knowledge and the skill to navigate tumultuous markets. Therefore, it is important to surround yourself with knowledgeable traders and investors who can not only see the dangers but can identify the opportunities.
We are simply standing on the cusp of a major transfer of wealth the likes of which we may never see again in our generation. The community of instructors and traders at Online Trading Academy have the skills to take advantage of this opportunity. Instead of fearing the market change and hiding until the dust settles, learn how you can increase your income and wealth to be able to live the lifestyle you choose. Live where you want, how you want, on your terms.
Read the original article here - Why is the Stock Market Down?
Neither Freedom Management Partners nor any of its personnel are registered broker-dealers or investment advisers. I will mention that I consider certain securities or positions to be good candidates for the types of strategies we are discussing or illustrating. Because I consider the securities or positions appropriate to the discussion or for illustration purposes does not mean that I am telling you to trade the strategies or securities. Keep in mind that we are not providing you with recommendations or personalized advice about your trading activities. The information we are providing is not tailored to any individual. Any mention of a particular security is not a recommendation to buy, sell, or hold that or any other security or a suggestion that it is suitable for any specific person. Keep in mind that all trading involves a risk of loss, and this will always be the situation, regardless of whether we are discussing strategies that are intended to limit risk. Also, Freedom Management Partners’ personnel are not subject to trading restrictions. I and others at Freedom Management Partners could have a position in a security or initiate a position in a security at any time.
Editors’ Picks

EUR/USD: US Dollar to remain pressured until uncertainty fog dissipates
Unimpressive European Central Bank left monetary policy unchanged for the fifth consecutive meeting. The United States first-tier employment and inflation data is scheduled for the second week of February. EUR/USD battles to remain afloat above 1.1800, sellers moving to the sidelines.

GBP/USD reclaims 1.3600 and above
GBP/USD reverses two straight days of losses, surpassing the key 1.3600 yardstick on Friday. Cable’s rebound comes as the Greenback slips away from two-week highs in response to some profit-taking mood and speculation of Fed rate cuts. In addition, hawkish comments from the BoE’s Pill are also collaborating with the quid’s improvement.

USD/JPY gathers strength to near 157.50 as Takaichi’s party wins snap elections
The USD/JPY pair attracts some buyers to around 157.45 during the early Asian session on Monday. The Japanese Yen weakens against the US Dollar after Japan’s ruling Liberal Democratic Party won an outright majority in Sunday’s lower house election, opening the door to more fiscal stimulus by Prime Minister Sanae Takaichi.
Editors’ Picks
USD/JPY gathers strength to near 157.50 as Takaichi’s party wins snap elections
The USD/JPY pair attracts some buyers to around 157.45 during the early Asian session on Monday. The Japanese Yen weakens against the US Dollar after Japan’s ruling Liberal Democratic Party won an outright majority in Sunday’s lower house election, opening the door to more fiscal stimulus by Prime Minister Sanae Takaichi.
EUR/USD: US Dollar to remain pressured until uncertainty fog dissipates
Unimpressive European Central Bank left monetary policy unchanged for the fifth consecutive meeting. The United States first-tier employment and inflation data is scheduled for the second week of February. EUR/USD battles to remain afloat above 1.1800, sellers moving to the sidelines.

Gold: Volatility persists in commodity space
After losing more than 8% to end the previous week, Gold remained under heavy selling pressure on Monday and dropped toward $4,400. Although XAU/USD staged a decisive rebound afterward, it failed to stabilize above $5,000. The US economic calendar will feature Nonfarm Payrolls and Consumer Price Index data for January, which could influence the market pricing of the Federal Reserve’s policy outlook and impact Gold’s performance.

Crypto Today: Bitcoin, Ethereum, XRP rebound amid risk-off, $2.6 billion liquidation wave
US NFP and CPI data awaited after Warsh’s nomination as Fed chief. Yen traders lock gaze on Sunday’s snap election. UK and Eurozone Q4 GDP data also on the agenda. China CPI and PPI could reveal more weakness in domestic demand.

Three scenarios for Japanese Yen ahead of snap election Premium
The latest polls point to a dominant win for the ruling bloc at the upcoming Japanese snap election. The larger Sanae Takaichi’s mandate, the more investors fear faster implementation of tax cuts and spending plans.
RECOMMENDED LESSONS
Making money in forex is easy if you know how the bankers trade!
I’m often mystified in my educational forex articles why so many traders struggle to make consistent money out of forex trading. The answer has more to do with what they don’t know than what they do know. After working in investment banks for 20 years many of which were as a Chief trader its second knowledge how to extract cash out of the market.
5 Forex News Events You Need To Know
In the fast moving world of currency markets where huge moves can seemingly come from nowhere, it is extremely important for new traders to learn about the various economic indicators and forex news events and releases that shape the markets. Indeed, quickly getting a handle on which data to look out for, what it means, and how to trade it can see new traders quickly become far more profitable and sets up the road to long term success.
Top 10 Chart Patterns Every Trader Should Know
Chart patterns are one of the most effective trading tools for a trader. They are pure price-action, and form on the basis of underlying buying and selling pressure. Chart patterns have a proven track-record, and traders use them to identify continuation or reversal signals, to open positions and identify price targets.
7 Ways to Avoid Forex Scams
The forex industry is recently seeing more and more scams. Here are 7 ways to avoid losing your money in such scams: Forex scams are becoming frequent. Michael Greenberg reports on luxurious expenses, including a submarine bought from the money taken from forex traders. Here’s another report of a forex fraud. So, how can we avoid falling in such forex scams?
What Are the 10 Fatal Mistakes Traders Make
Trading is exciting. Trading is hard. Trading is extremely hard. Some say that it takes more than 10,000 hours to master. Others believe that trading is the way to quick riches. They might be both wrong. What is important to know that no matter how experienced you are, mistakes will be part of the trading process.
The challenge: Timing the market and trader psychology
Successful trading often comes down to timing – entering and exiting trades at the right moments. Yet timing the market is notoriously difficult, largely because human psychology can derail even the best plans. Two powerful emotions in particular – fear and greed – tend to drive trading decisions off course.