Why New York Charts...
Why any serious trader should use the New York Close chart? Learning to trade the forex market can be a tough experience. You have probably read a lot of articles about trading strategies, registered to various online forex forums, and you are practicing whenever you have time to look at the charts. But, there is probably one thing that you've missed, that can have an enormous difference in your trading performance and learning efforts.
It's the type of charts that you use. To make the right trading decisions based on price-action, you need a simple and clean chart which shows you the real market sentiment, is compact and not cluttered with unnecessary information. You may ask, "Wait, but all charts are the same, aren't they?" -No, they are not. There is actually a big difference in the price feeds that forex brokers are using, with two main probably one thing that you’ve missed, that can have an enormous difference in your trading performance charts which we will discuss below: the GMT chart, and the New York Close chart.
The FOREX Market and New York Charts
Let me explain. The forex market is open six days per week, 24 hours a day. The New York session, London session, and Asia-Pacific trading session are all open at a different time, which makes the forex market open around the clock. The following table shows when the trading sessions open according to EST and GMT time zones.
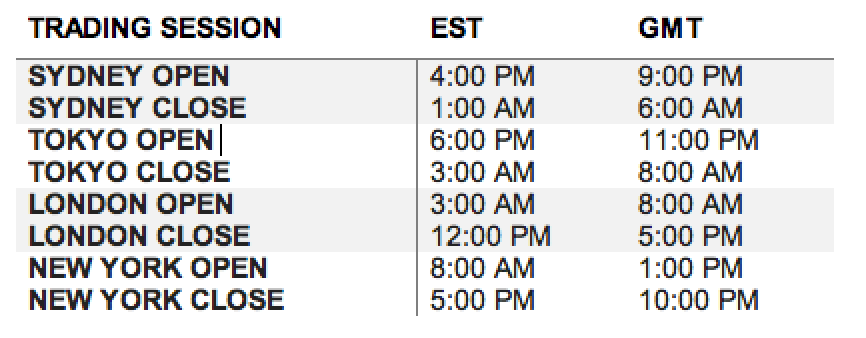
Not all trading sessions have the same daily trading volume. You probably already know, that most of the market volatility takes place with the overlap between the London and New York session, which is from 8:00 AM to 12:00 PM EST. After that, the only session which has a significant market impact is the New York session, which ends each day at 5:00 PM from Monday to Friday. A more thorough explanation of why I am using the Daily timeframe can be found HERE.
What you want to look at is the closing price of the New York session. Unfortunately, the majority of brokers use chart types that are based on GMT time. This means, each candle opens at exactly 00:00 AM GMT, which creates a total of six daily candles per week. This type of charting creates unnecessary confusion and fake signals, as it usually has a small "Sunday" candle which opens at Sunday 11:00 PM GMT and closes at 00:00 AM GMT.
Be Careful: GMT charts are cluttered with redundant, unnecessary information (candles) which can also be confused with doji candles. Doji candles have a small body and usually mean a possible trend reversal, but as they are not true daily candles they are not relevant!
New York Close charts, on the other hand, have a total of five candles during a week and equal the closing price of each New York session. The closing prices are the most important number for price-action trading, as they truly represent the fight between bulls and bears and show who won the battle in the previous trading session.
In a nutshell, charts that don't rely on the New York Close are not suitable for any type of professional trading and analysis and I can't recommend them at all. Beside the small "Sunday" candles that clutter the chart and create fake signals, the particular closing prices of GMT charts are not showing the real picture of the market sentiment. In the end, if you are not using New York Close FOREX Charts, you will not see the same results. That's why I encourage you to try them, especially if you are serious about price-action trading.
What Is The Difference Between GMT and New York Close Charts On The Screens?
Let's take a look at the difference between a GMT chart and a New York Close chart.
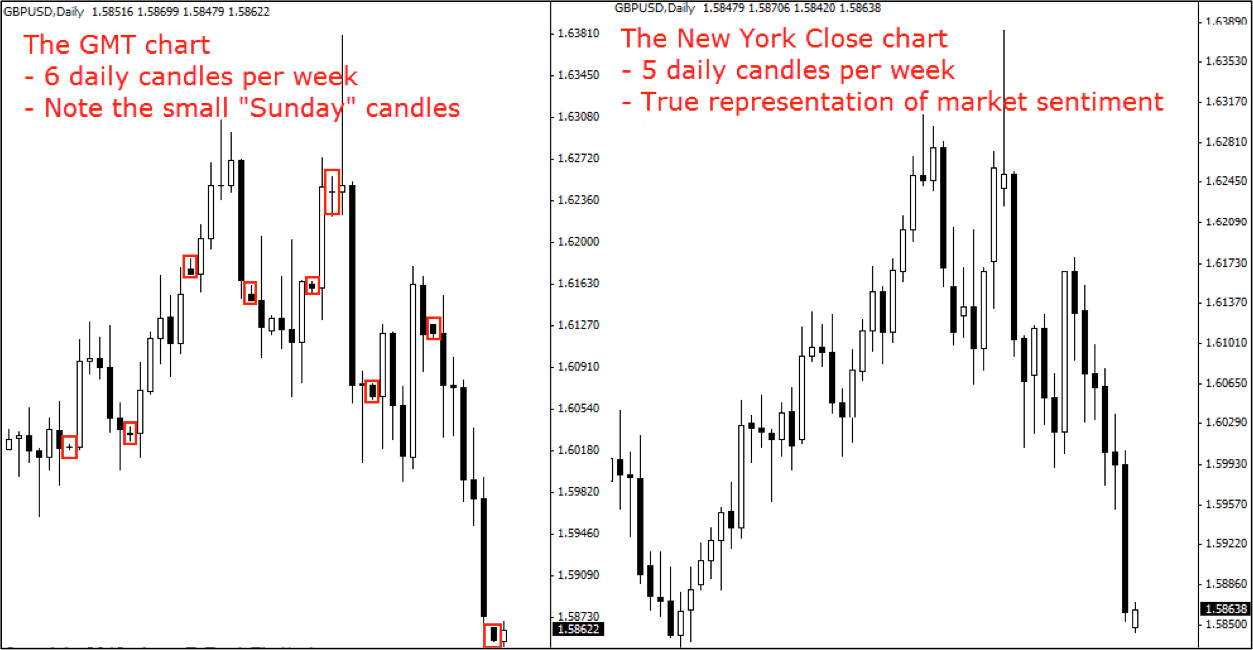
As you can see, the New York Close chart has no unnecessary "Sunday" candles which can confuse traders. Notice the small candles in red on the left GMT chart.
Be careful: If you rely on candlestick patterns in your trading, GMT charts would generate a lot of fake signals which could ultimately cost you a lot of money.
There are a lot of dojis and other candlesticks with small bodies, due to the small time-frame that they represent (only one hour after the Tokyo session opens). The New York Close chart, on the other hand, represents exactly the New York session trading day, which is extremely important for price-action trading. Closing prices are the most important prices for any market, not just forex. To make the right trading decisions, you need to make sure that you have the right price feed.
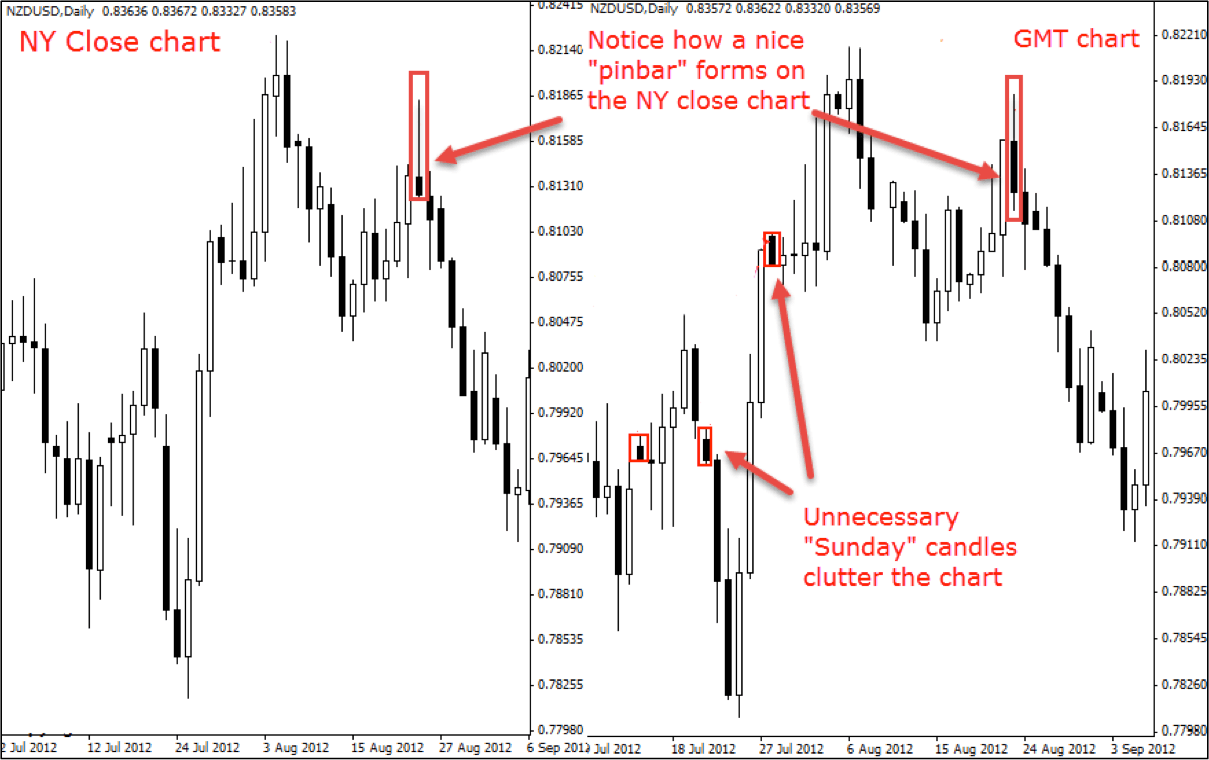
Look at the real-life difference between the NY Close chart (left) and GMT chart (right). While a nice pinbar candlestick forms on the NY Close chart, which triggers a profitable short position afterwards, there is nothing similar on the GMT chart. Even more, the "Sunday" candles dilute traders' attention and can give costly "fake signals", i.e. if the irrelevant "Sunday" candles form a doji or shooting star.
If you don't know which charts your broker uses, the easiest way to find out is by watching when the daily candle closes.
Tip: If the time is different from 5:00 PM EST, your broker uses another chart feed than the New York Close, most probably the GMT type of chart.
Final Words
am not saying that you can't be a profitable trader with GMT charts. I have traded myself on GMT charts before I discovered the New York Close charts. Once you switch to New York Close charts, you will immediately feel the difference while just looking at the chart – it's more compact, has 5 daily candles during a week, and you know that each candle's closing price represents the close of the New York session at 5:00 PM EST. I find it now much easier to discover profitable trading patterns while looking at the New York Close charts.
If you want to become a professional price-action trader, one of the most important things is to start from the foundation – which are the charts. You want compact and clean charts, which truly represent the fight between the bulls and the bears.
Happy Trading,
This material is written for educational purposes only. By no means do any of its contents recommend, advocate or urge the buying, selling or holding of any financial instrument whatsoever. Trading and Investing involves high levels of risk. The author expresses personal opinions and will not assume any responsibility whatsoever for the actions of the reader. The author may or may not have positions in Financial Instruments discussed in this newsletter. Future results can be dramatically different from the opinions expressed herein. Past performance does not guarantee future results.
Editors’ Picks

EUR/USD treads water around 1.1900
EUR/USD edges a tad lower around the 1.1900 area, coming under mild pressure despite the US Dollar keeps the offered stance on turnaround Tuesday. On the US data front, December Retail Sales fell short of expectations, while the ADP four week average printed at 6.5K.

GBP/USD looks weak near 1.3670
GBP/USD trades on the back foot around the 1.3670 region on Tuesday. Cable’s modest retracement also comes in tandem with the decent decline in the Greenback. Moving forward, the US NFP and CPI data in combination with key UK releases should kee the quid under scrutiny in the next few days.

USD/JPY drops toward 155.00 as focus shifts to US data
USD/JPY meets fresh supply and inches closer toward 155.00 in the Asian session on Tuesday. The Japanese Yen holds the upper hand over the US Dollar after Japanese Prime Minister Sanae Takaichi led the ruling Liberal Democratic Party to a historic landslide win and on intervention talks. Traders brace for key US economic data that could offer more clues on the Federal Reserve's monetary policy.
Editors’ Picks
EUR/USD treads water around 1.1900
EUR/USD edges a tad lower around the 1.1900 area, coming under mild pressure despite the US Dollar keeps the offered stance on turnaround Tuesday. On the US data front, December Retail Sales fell short of expectations, while the ADP four week average printed at 6.5K.
GBP/USD looks weak near 1.3670
GBP/USD trades on the back foot around the 1.3670 region on Tuesday. Cable’s modest retracement also comes in tandem with the decent decline in the Greenback. Moving forward, the US NFP and CPI data in combination with key UK releases should kee the quid under scrutiny in the next few days.

Gold the battle of wills continues with bulls not ready to give up
Gold comes under marked selling pressure on Tuesday, giving back part of its recent two day advance and threatening to challenge the key $5,000 mark per troy ounce. The yellow metal’s correction follows a better tone in the risk complex, a lower Greenback and shrinking US Treasuty yields.

AI Crypto Update: BankrCoin, Pippin surge as sector market cap steadies above $12B
The Artificial Intelligence (AI) segment is largely on the back foot with major coins such as Bittensor (TAO) and Internet Computer (ICP) extending losses amid a sticky risk-off sentiment.

Dollar drops and stocks rally: The week of reckoning for US economic data
Following a sizeable move lower in US technology Stocks last week, we have witnessed a meaningful recovery unfold. The USD Index is in a concerning position; the monthly price continues to hold the south channel support.
RECOMMENDED LESSONS
Making money in forex is easy if you know how the bankers trade!
I’m often mystified in my educational forex articles why so many traders struggle to make consistent money out of forex trading. The answer has more to do with what they don’t know than what they do know. After working in investment banks for 20 years many of which were as a Chief trader its second knowledge how to extract cash out of the market.
5 Forex News Events You Need To Know
In the fast moving world of currency markets where huge moves can seemingly come from nowhere, it is extremely important for new traders to learn about the various economic indicators and forex news events and releases that shape the markets. Indeed, quickly getting a handle on which data to look out for, what it means, and how to trade it can see new traders quickly become far more profitable and sets up the road to long term success.
Top 10 Chart Patterns Every Trader Should Know
Chart patterns are one of the most effective trading tools for a trader. They are pure price-action, and form on the basis of underlying buying and selling pressure. Chart patterns have a proven track-record, and traders use them to identify continuation or reversal signals, to open positions and identify price targets.
7 Ways to Avoid Forex Scams
The forex industry is recently seeing more and more scams. Here are 7 ways to avoid losing your money in such scams: Forex scams are becoming frequent. Michael Greenberg reports on luxurious expenses, including a submarine bought from the money taken from forex traders. Here’s another report of a forex fraud. So, how can we avoid falling in such forex scams?
What Are the 10 Fatal Mistakes Traders Make
Trading is exciting. Trading is hard. Trading is extremely hard. Some say that it takes more than 10,000 hours to master. Others believe that trading is the way to quick riches. They might be both wrong. What is important to know that no matter how experienced you are, mistakes will be part of the trading process.
The challenge: Timing the market and trader psychology
Successful trading often comes down to timing – entering and exiting trades at the right moments. Yet timing the market is notoriously difficult, largely because human psychology can derail even the best plans. Two powerful emotions in particular – fear and greed – tend to drive trading decisions off course.