![]() Brandon Wendell, CMT
Brandon Wendell, CMT
Brandon Wendell
Online Trading Academy graduates know that their trading decisions should be based on price action and volume in the same manner that professional traders do. Technical indicators are very popular in the trading community and can be helpful in reading price action, but they should only ever be used as an odds enhancer. It is important to remember that an odds enhancer is part of a scoring system that is used to increase the probability of a trade working out, not to signal the entrance to a trade itself.
Trades should be executed based on price analysis and supply and demand levels. Whenever I start to discuss technical indicators, everyone always asks me what my favorite one is. I never get bored from watching the disappointment on their faces when I answer, “Price!”
You need to understand that technical indicators are built on past price and sometimes volume in relationship to that price. If you realize the mechanics of the indicator, then you know what it reports in relation to price movement and when the indicator will give signals by simply reading price on a chart. When you can do this, then you can predict the signals of an indicator before they actually occur. This will place you ahead of those who are relying on that indicator to render a buy or sell signal prior to acting.
Stochastic Indicators
Stochastic indicators, for instance, only tell you where the current price close for a period is in relation to a range of price movements for a defined period in the past. Online Trading Academy graduates who learn how to read price properly are able to see certain colors and shapes of the candles on their charts and know what the indicator would read before the signal is given. Remember, the most recent candle must close before a signal is generated on an indicator. Anticipation of the signal based on actual price movement allows you to take action before the novices.
Indicators can be helpful when used properly. Since the buy or sell signals usually appear late, we must observe the behavior of the indicator and take our signals from changes in that behavior.
Divergence
Enter divergence. Divergence is when the indicator is not exhibiting the same characteristics as the price of the security. When prices rise in an uptrend, you should be seeing higher highs and higher lows for the uptrend in price. You should also be seeing higher highs being made in the indicators. The upward movement in some indicators measures momentum. In an uptrend, the momentum should be increasing for the trend to continue.
The opposite is true when in a downtrend. In a downtrend there should be lower lows both in price and the indicator to show bearish momentum continuing the trend
When the trend is moving with less momentum, it is likely coming to an end. Think of a car. If you keep your foot on the accelerator, you keep moving and will go faster. Once you let up from the pedal, your momentum slows and you will eventually come to a stop. This is the same as divergence. Your car’s movement is price and the pressure on the pedal is the indicator, without the pressure, the car cannot continue to move.
There are two types of divergence: positive and negative.
Positive divergence typically signals the pause or end of a downtrend. In positive divergence, the price of the security makes lower lows and lower highs, a downtrend. However, the indicator makes the same lows or possibly higher lows.
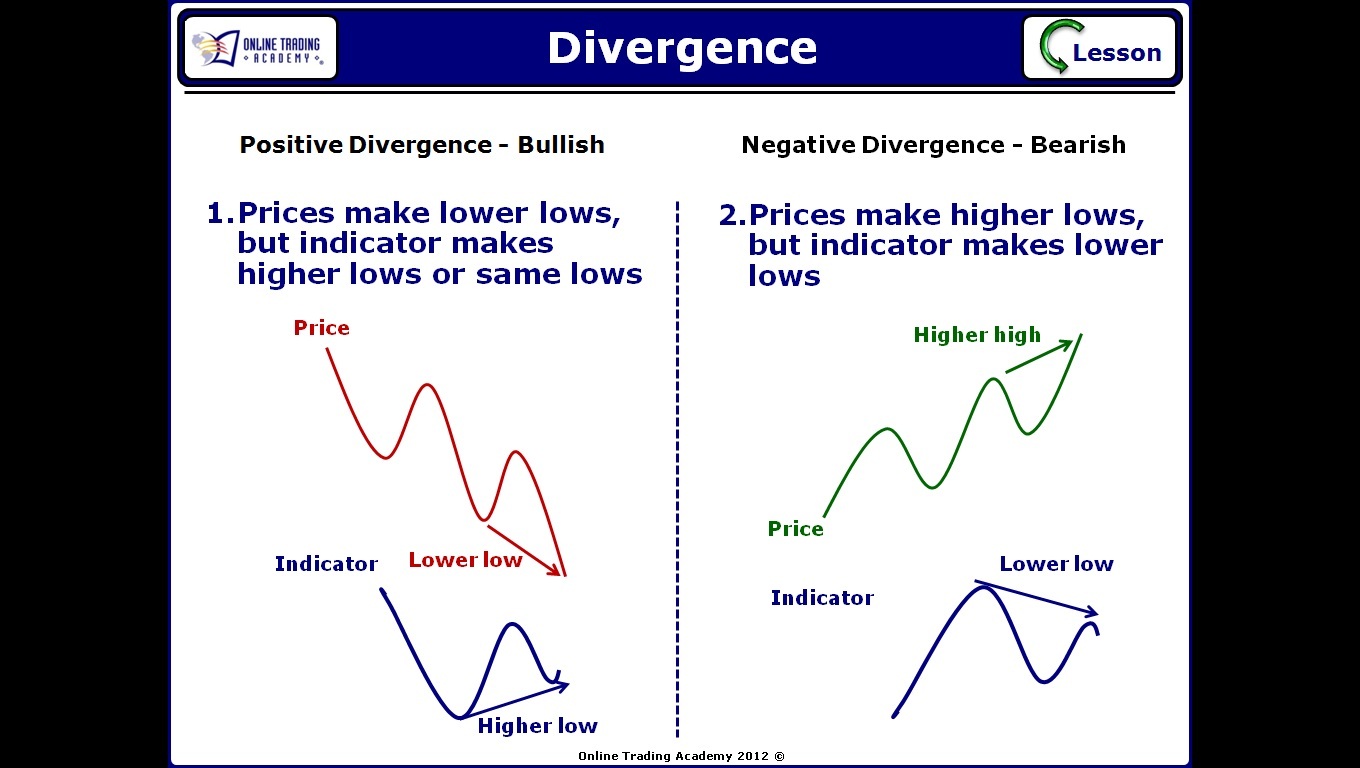
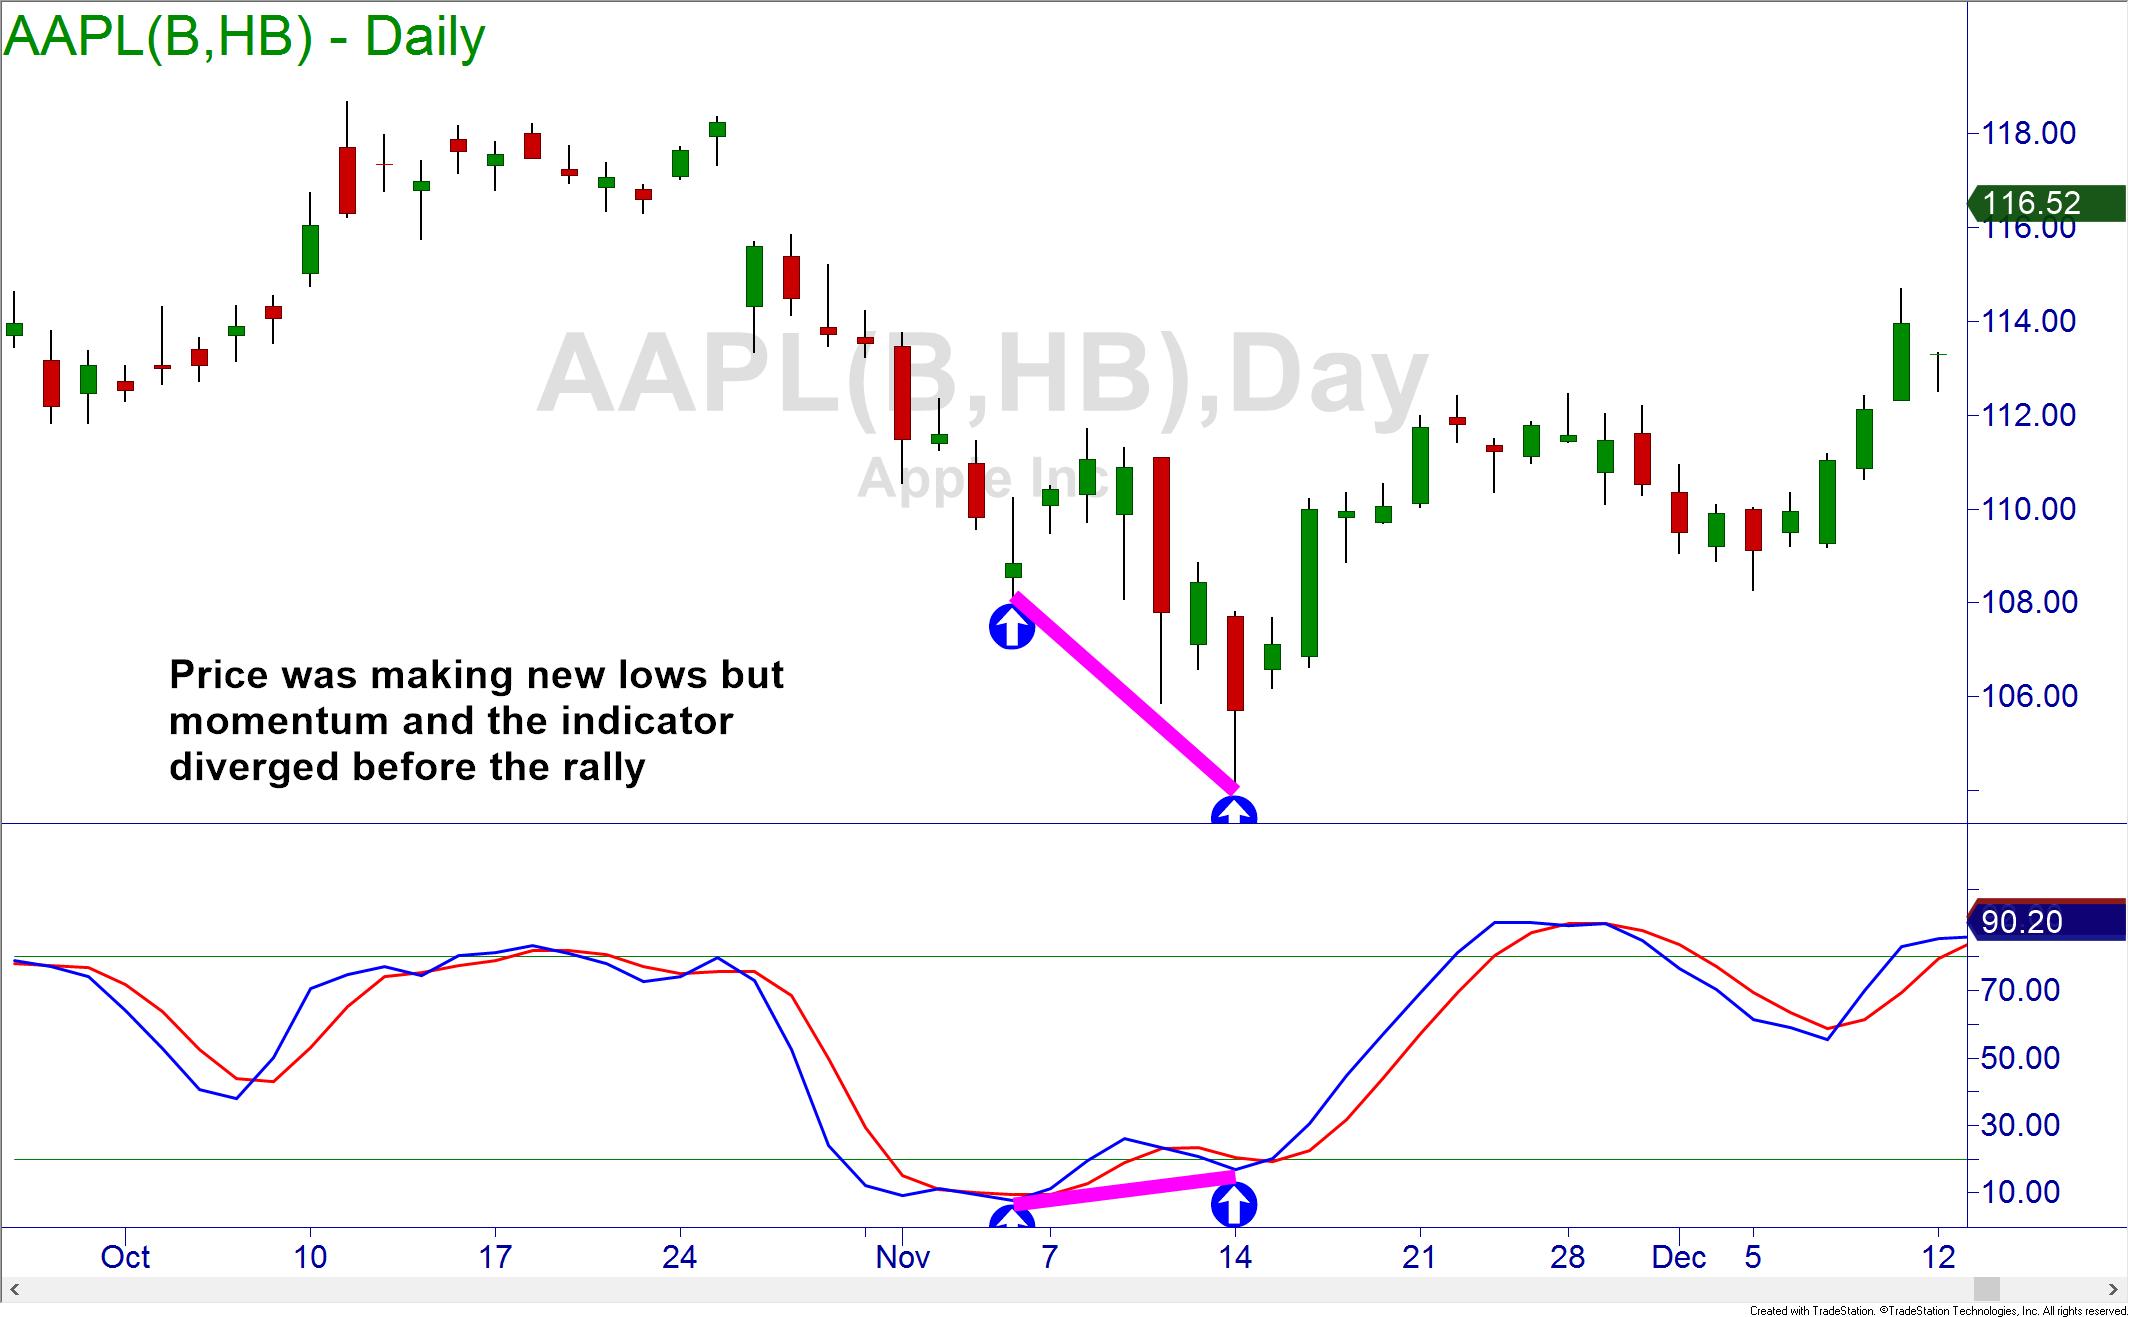
The divergence of the indicator shows that even though prices are continuing in the trend, they are doing so with less momentum and are unlikely to continue without a pause, correction or even a reversal. This is shown in the following chart with positive divergence in the Stochastics.
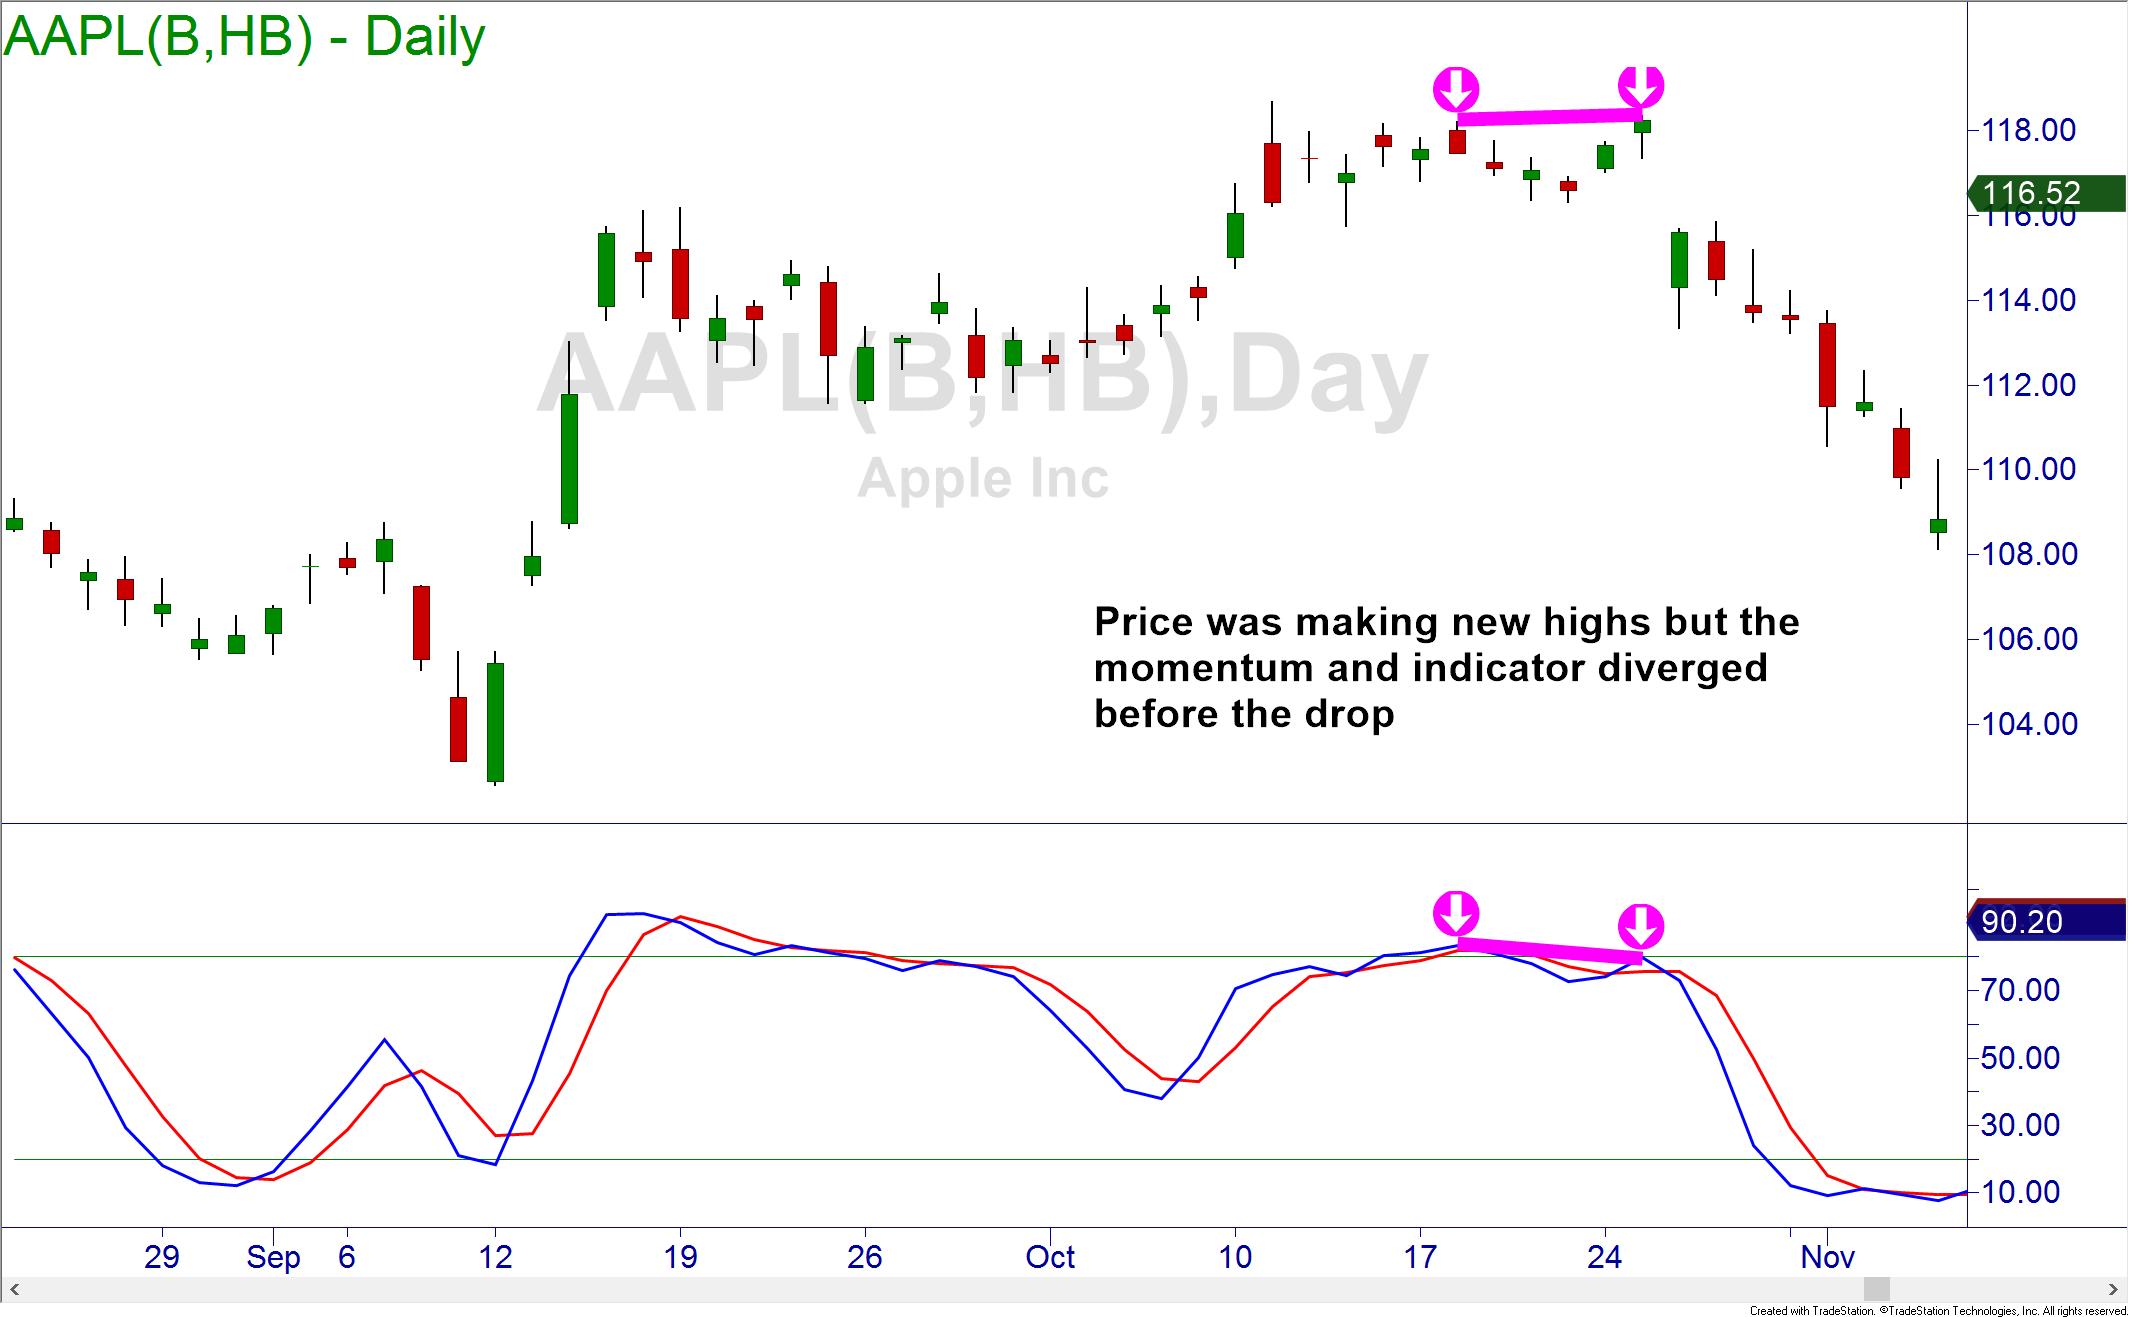
Negative divergence typically signals the end, pause or correction of an uptrend. It occurs when prices are making higher highs and higher lows (an uptrend), but the indicator makes similar or lower highs. This lack of momentum being demonstrated by price and reflected in the indicator is a signal of weakness of the trend. Be watchful for reversal signals in this environment.
A trader can use technical indicators, but you want to be sure to use them properly. You need to know when divergence is signaling a reversal or a pause in price.
There are other factors that must be included to make the correct decision. Relying solely on indicators to signal your entry or exit to trades could lead to disaster. Looking for divergence to confirm your trade that was based on price action is the best way.
Neither Freedom Management Partners nor any of its personnel are registered broker-dealers or investment advisers. I will mention that I consider certain securities or positions to be good candidates for the types of strategies we are discussing or illustrating. Because I consider the securities or positions appropriate to the discussion or for illustration purposes does not mean that I am telling you to trade the strategies or securities. Keep in mind that we are not providing you with recommendations or personalized advice about your trading activities. The information we are providing is not tailored to any individual. Any mention of a particular security is not a recommendation to buy, sell, or hold that or any other security or a suggestion that it is suitable for any specific person. Keep in mind that all trading involves a risk of loss, and this will always be the situation, regardless of whether we are discussing strategies that are intended to limit risk. Also, Freedom Management Partners’ personnel are not subject to trading restrictions. I and others at Freedom Management Partners could have a position in a security or initiate a position in a security at any time.
Editors’ Picks

EUR/USD hits two-day highs near 1.1820
EUR/USD picks up pace and reaches two-day tops around 1.1820 at the end of the week. The pair’s move higher comes on the back of renewed weakness in the US Dollar amid growing talk that the Fed could deliver an interest rate cut as early as March. On the docket, the flash US Consumer Sentiment improves to 57.3 in February.

GBP/USD reclaims 1.3600 and above
GBP/USD reverses two straight days of losses, surpassing the key 1.3600 yardstick on Friday. Cable’s rebound comes as the Greenback slips away from two-week highs in response to some profit-taking mood and speculation of Fed rate cuts. In addition, hawkish comments from the BoE’s Pill are also collaborating with the quid’s improvement.

USD/JPY drops back below 157.00, as focus shifts to Japan snap election
USD/JPY is back in the red below 157.00 in the Asian session on Friday. The Japanese Yen recovers ground against the US Dollar amid some profit-taking ahead of Japan's snap general election on Sunday. The preliminary reading of the Michigan Consumer Sentiment Index report for February will be released later on Friday.
Editors’ Picks

EUR/USD: US Dollar to remain pressured until uncertainty fog dissipates Premium
The EUR/USD pair lost additional ground in the first week of February, settling at around 1.1820. The reversal lost momentum after the pair peaked at 1.2082 in January, its highest since mid-2021.

Gold: Volatility persists in commodity space Premium
After losing more than 8% to end the previous week, Gold (XAU/USD) remained under heavy selling pressure on Monday and dropped toward $4,400. Although XAU/USD staged a decisive rebound afterward, it failed to stabilize above $5,000.

GBP/USD: Pound Sterling tests key support ahead of a big week Premium
The Pound Sterling (GBP) changed course against the US Dollar (USD), with GBP/USD giving up nearly 200 pips in a dramatic correction.

Bitcoin: The worst may be behind us
Bitcoin (BTC) price recovers slightly, trading at $65,000 at the time of writing on Friday, after reaching a low of $60,000 during the early Asian trading session. The Crypto King remained under pressure so far this week, posting three consecutive weeks of losses exceeding 30%.

Three scenarios for Japanese Yen ahead of snap election Premium
The latest polls point to a dominant win for the ruling bloc at the upcoming Japanese snap election. The larger Sanae Takaichi’s mandate, the more investors fear faster implementation of tax cuts and spending plans.
RECOMMENDED LESSONS
Making money in forex is easy if you know how the bankers trade!
I’m often mystified in my educational forex articles why so many traders struggle to make consistent money out of forex trading. The answer has more to do with what they don’t know than what they do know. After working in investment banks for 20 years many of which were as a Chief trader its second knowledge how to extract cash out of the market.
5 Forex News Events You Need To Know
In the fast moving world of currency markets where huge moves can seemingly come from nowhere, it is extremely important for new traders to learn about the various economic indicators and forex news events and releases that shape the markets. Indeed, quickly getting a handle on which data to look out for, what it means, and how to trade it can see new traders quickly become far more profitable and sets up the road to long term success.
Top 10 Chart Patterns Every Trader Should Know
Chart patterns are one of the most effective trading tools for a trader. They are pure price-action, and form on the basis of underlying buying and selling pressure. Chart patterns have a proven track-record, and traders use them to identify continuation or reversal signals, to open positions and identify price targets.
7 Ways to Avoid Forex Scams
The forex industry is recently seeing more and more scams. Here are 7 ways to avoid losing your money in such scams: Forex scams are becoming frequent. Michael Greenberg reports on luxurious expenses, including a submarine bought from the money taken from forex traders. Here’s another report of a forex fraud. So, how can we avoid falling in such forex scams?
What Are the 10 Fatal Mistakes Traders Make
Trading is exciting. Trading is hard. Trading is extremely hard. Some say that it takes more than 10,000 hours to master. Others believe that trading is the way to quick riches. They might be both wrong. What is important to know that no matter how experienced you are, mistakes will be part of the trading process.
The challenge: Timing the market and trader psychology
Successful trading often comes down to timing – entering and exiting trades at the right moments. Yet timing the market is notoriously difficult, largely because human psychology can derail even the best plans. Two powerful emotions in particular – fear and greed – tend to drive trading decisions off course.