![]() Rick Wright
Rick Wright
Online Trading Academy
Hello traders! I’ve just come from our beautiful Woodland Hills, California office, and one of our veteran students asked me a question about Japanese candlesticks, specifically referring to an article I wrote a couple of years ago. With his questions in mind, I’d like to expand on how I use weekly candles to give me a bias for the following week. Let’s go!
Now that you have read that previous article, let’s talk about what to do if we aren’t already in a trade on the currency pair in question. In the following AUDUSD pair of charts, let’s say you find yourself looking at the pair around the time frame marked 1. Obviously, the pair has already had a large move to the down side, so you aren’t still looking for shorts way down here are you? You especially shouldn’t be with the big round number of .7500 hanging out down here (a psychological level of support/resistance.) Instead, when the first green bodied candle in this new uptrend decisively breaks past the previous week’s high price, you decide to look for long trades. That previous week’s high was formed on 12/05, and didn’t break until 12/14.
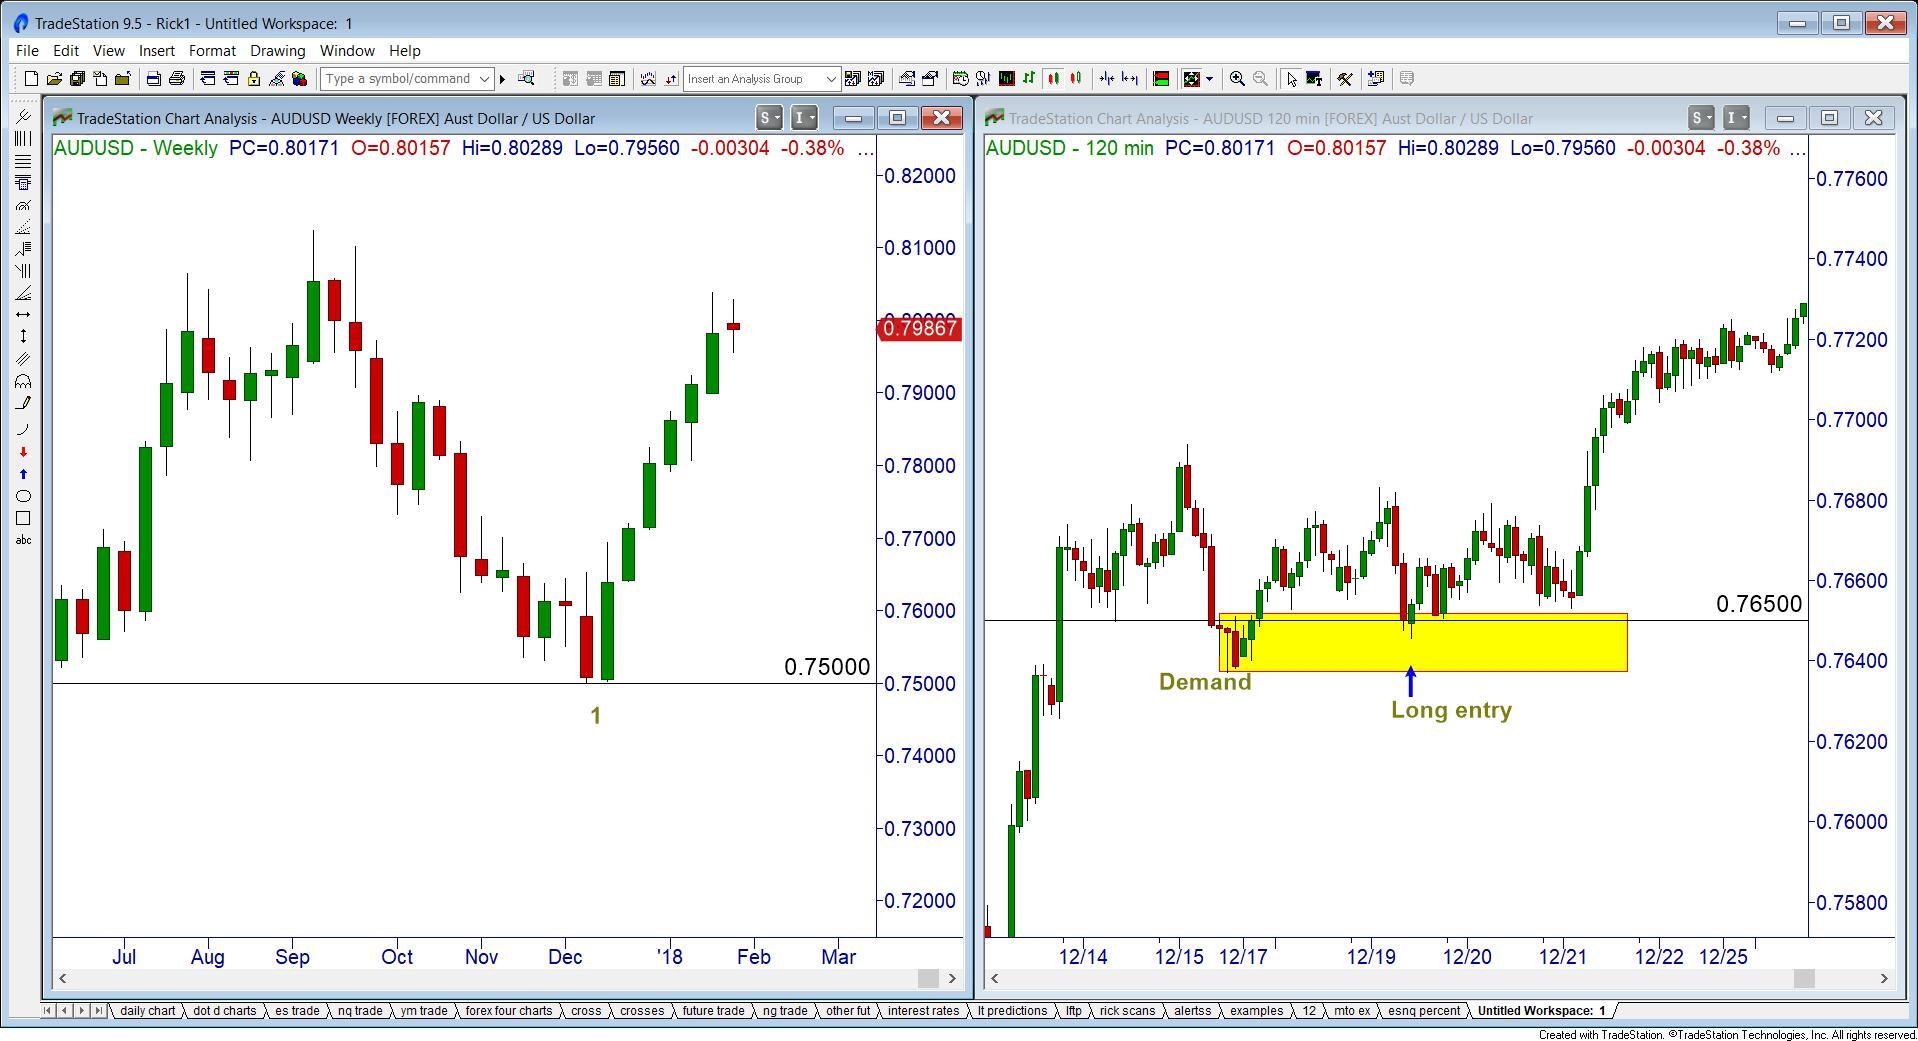
After the major players have given you the hint that they are no longer shorting, but going long, we can now look for long trades on our smaller timeframes. In the corresponding one-hour chart, you had an opportunity to buy on 12/19 near the 0.7650 mark. While it took a couple of days for you to make a lot of pips, the signal was clear.
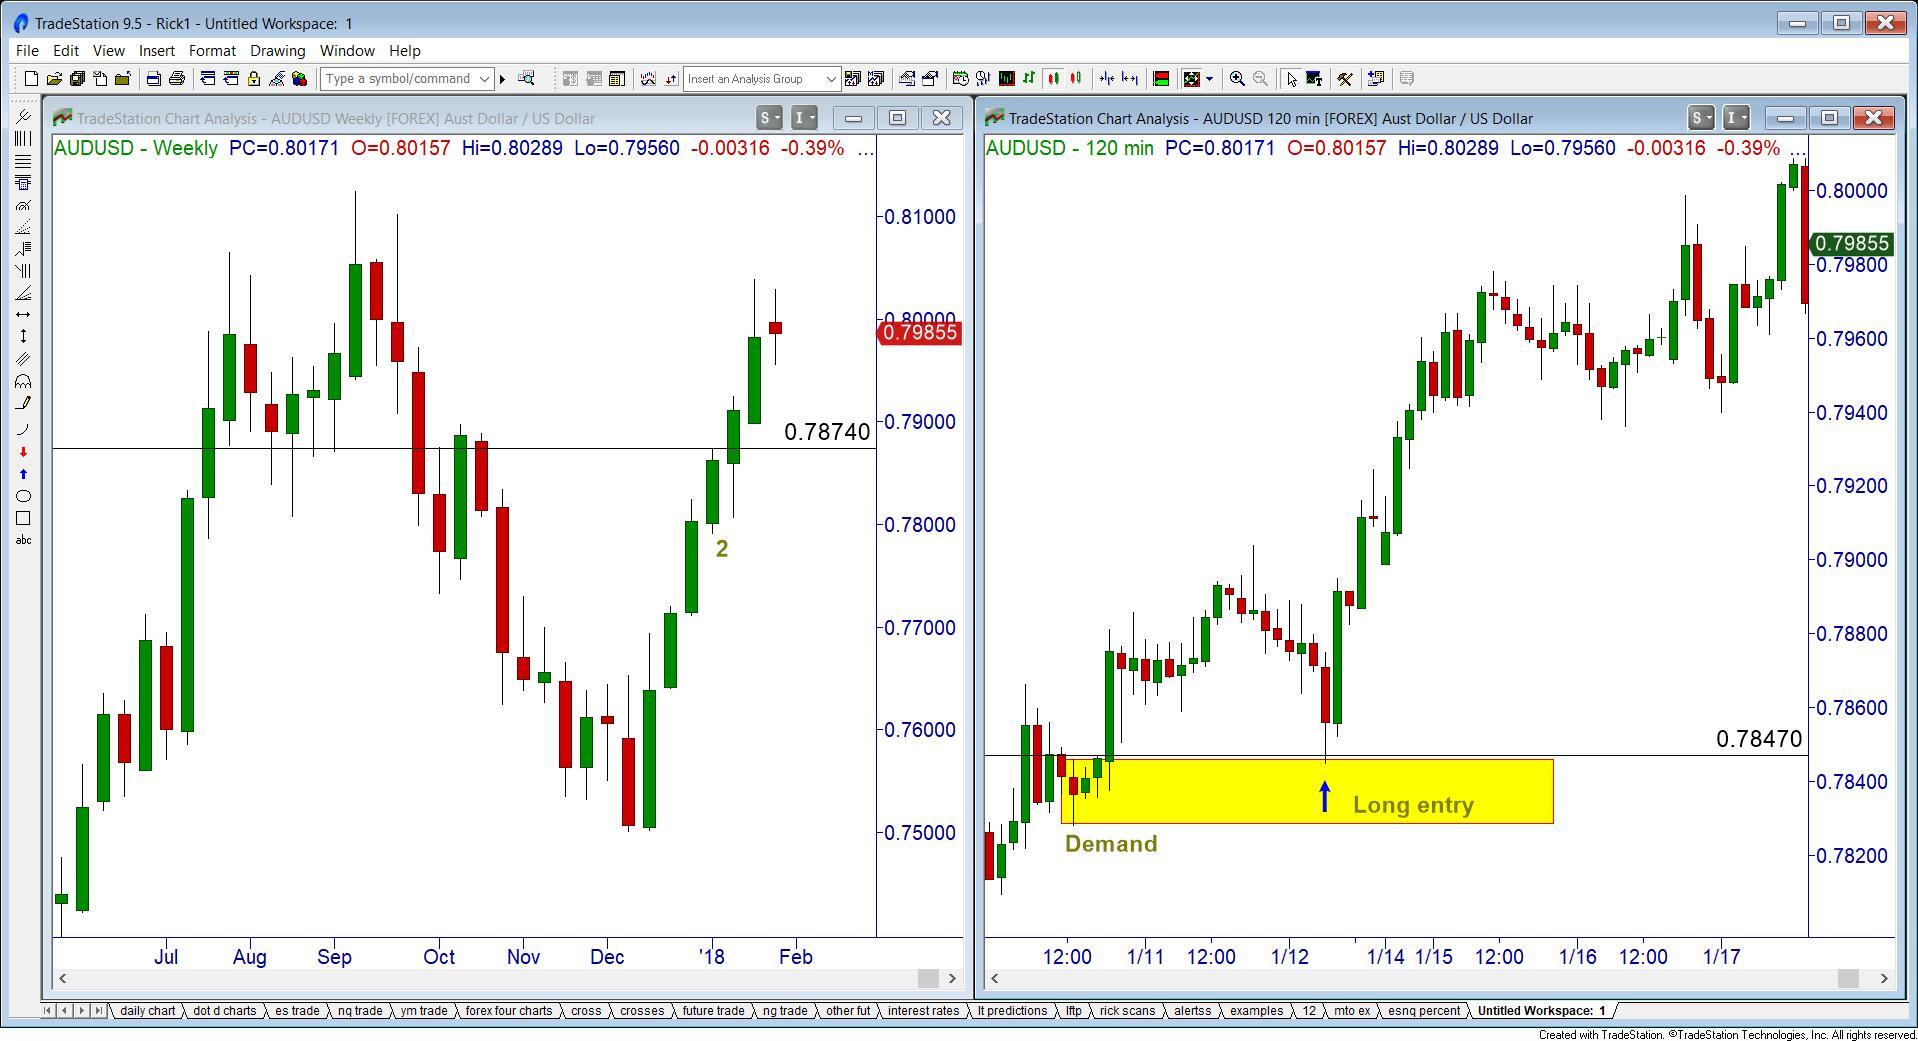
OK, let’s say you missed that one, end of year holidays and all. How about one after the start of the year?
In this next picture, you noticed a weekly high of about 0.7874 that happened on Jan 5. (This weekly candle is marked 2). Once you had permission to look for long trades, as the previous weekly candles high had been broken, you could have gotten long around the 0.7847 mark. By using this technique, you won’t be early or first to these trades by any means; however, your probability of being correct in this direction will go up substantially. Now, seeing where this chart is currently trading (at the time of this writing), I wouldn’t still be going long using these time frames. If you are long, please continue to manage your winning trades appropriately!
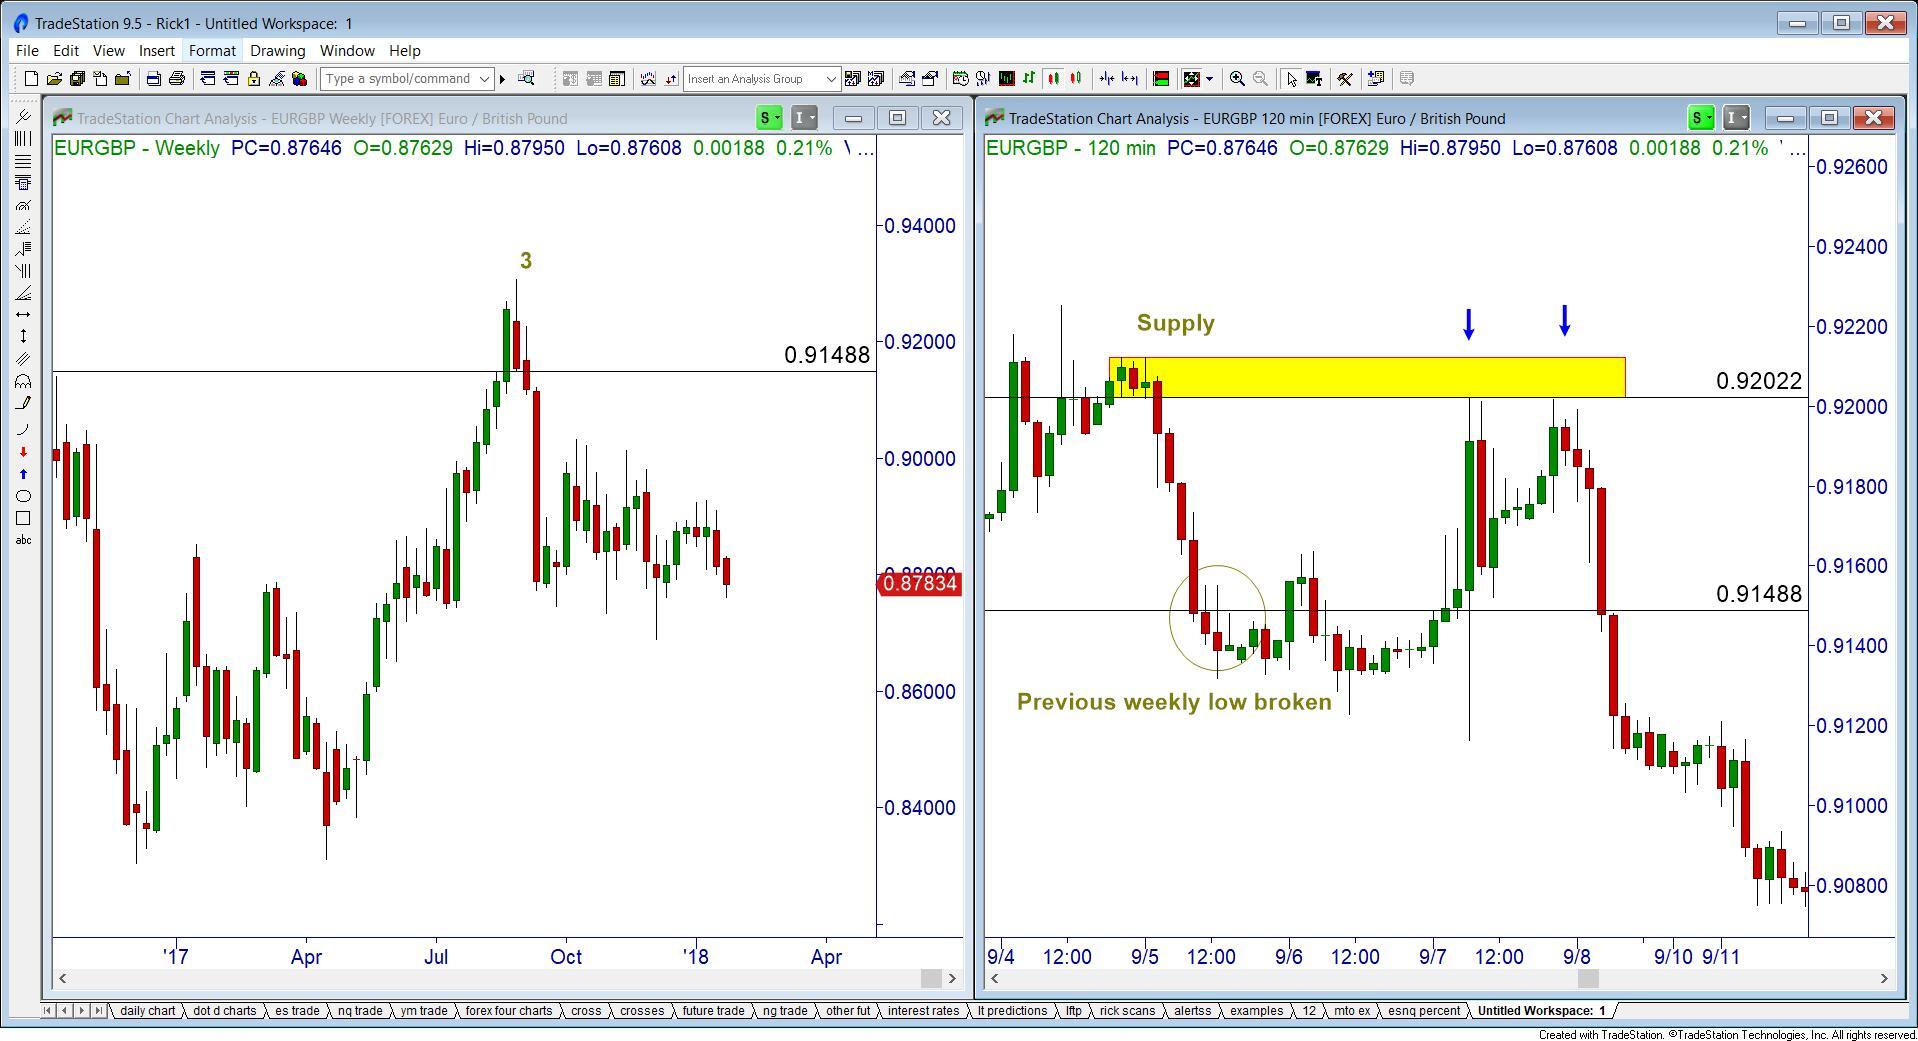
Now, how about an example for the short side? The weekly low on the EURGBP was on Sept 1, and was broken the following week on Sept 5. (Weekly candle marked as 3). Once you had your short bias, or your permission to look for short trades, we must wait for a rally into supply to take any short opportunities. On both Sept 7 and 8 we had chances to get into this short trade.
Now, I must make a couple of things super duper clear. This technique to get a long trade or short trade bias works very well during up or down trending markets. When you find a chart that is going sideways, our third trend direction, this bias technique will not help much at all! In fact, it may hurt more than it helps! The second point I want to make is, you must also take into consideration what the trend HAS BEEN. If your trend has been going UP for several weeks, taking you into a long term supply level, I would definitely NOT be looking to continue trying to find trades on the long side. On the other side, if your trend has been going DOWN for several weeks, taking you into long term demand, I wouldn’t be looking for any more short trades.
This content is intended to provide educational information only. This information should not be construed as individual or customized legal, tax, financial or investment services. As each individual's situation is unique, a qualified professional should be consulted before making legal, tax, financial and investment decisions. The educational information provided in this article does not comprise any course or a part of any course that may be used as an educational credit for any certification purpose and will not prepare any User to be accredited for any licenses in any industry and will not prepare any User to get a job. Reproduced by permission from OTAcademy.com click here for Terms of Use: https://www.otacademy.com/about/terms
Editors’ Picks

EUR/USD hits two-day highs near 1.1820
EUR/USD picks up pace and reaches two-day tops around 1.1820 at the end of the week. The pair’s move higher comes on the back of renewed weakness in the US Dollar amid growing talk that the Fed could deliver an interest rate cut as early as March. On the docket, the flash US Consumer Sentiment improves to 57.3 in February.

GBP/USD reclaims 1.3600 and above
GBP/USD reverses two straight days of losses, surpassing the key 1.3600 yardstick on Friday. Cable’s rebound comes as the Greenback slips away from two-week highs in response to some profit-taking mood and speculation of Fed rate cuts. In addition, hawkish comments from the BoE’s Pill are also collaborating with the quid’s improvement.

USD/JPY drops back below 157.00, as focus shifts to Japan snap election
USD/JPY is back in the red below 157.00 in the Asian session on Friday. The Japanese Yen recovers ground against the US Dollar amid some profit-taking ahead of Japan's snap general election on Sunday. The preliminary reading of the Michigan Consumer Sentiment Index report for February will be released later on Friday.
Editors’ Picks

EUR/USD: US Dollar to remain pressured until uncertainty fog dissipates Premium
The EUR/USD pair lost additional ground in the first week of February, settling at around 1.1820. The reversal lost momentum after the pair peaked at 1.2082 in January, its highest since mid-2021.

Gold: Volatility persists in commodity space Premium
After losing more than 8% to end the previous week, Gold (XAU/USD) remained under heavy selling pressure on Monday and dropped toward $4,400. Although XAU/USD staged a decisive rebound afterward, it failed to stabilize above $5,000.

GBP/USD: Pound Sterling tests key support ahead of a big week Premium
The Pound Sterling (GBP) changed course against the US Dollar (USD), with GBP/USD giving up nearly 200 pips in a dramatic correction.

Bitcoin: The worst may be behind us
Bitcoin (BTC) price recovers slightly, trading at $65,000 at the time of writing on Friday, after reaching a low of $60,000 during the early Asian trading session. The Crypto King remained under pressure so far this week, posting three consecutive weeks of losses exceeding 30%.

Three scenarios for Japanese Yen ahead of snap election Premium
The latest polls point to a dominant win for the ruling bloc at the upcoming Japanese snap election. The larger Sanae Takaichi’s mandate, the more investors fear faster implementation of tax cuts and spending plans.
RECOMMENDED LESSONS
Making money in forex is easy if you know how the bankers trade!
I’m often mystified in my educational forex articles why so many traders struggle to make consistent money out of forex trading. The answer has more to do with what they don’t know than what they do know. After working in investment banks for 20 years many of which were as a Chief trader its second knowledge how to extract cash out of the market.
5 Forex News Events You Need To Know
In the fast moving world of currency markets where huge moves can seemingly come from nowhere, it is extremely important for new traders to learn about the various economic indicators and forex news events and releases that shape the markets. Indeed, quickly getting a handle on which data to look out for, what it means, and how to trade it can see new traders quickly become far more profitable and sets up the road to long term success.
Top 10 Chart Patterns Every Trader Should Know
Chart patterns are one of the most effective trading tools for a trader. They are pure price-action, and form on the basis of underlying buying and selling pressure. Chart patterns have a proven track-record, and traders use them to identify continuation or reversal signals, to open positions and identify price targets.
7 Ways to Avoid Forex Scams
The forex industry is recently seeing more and more scams. Here are 7 ways to avoid losing your money in such scams: Forex scams are becoming frequent. Michael Greenberg reports on luxurious expenses, including a submarine bought from the money taken from forex traders. Here’s another report of a forex fraud. So, how can we avoid falling in such forex scams?
What Are the 10 Fatal Mistakes Traders Make
Trading is exciting. Trading is hard. Trading is extremely hard. Some say that it takes more than 10,000 hours to master. Others believe that trading is the way to quick riches. They might be both wrong. What is important to know that no matter how experienced you are, mistakes will be part of the trading process.
The challenge: Timing the market and trader psychology
Successful trading often comes down to timing – entering and exiting trades at the right moments. Yet timing the market is notoriously difficult, largely because human psychology can derail even the best plans. Two powerful emotions in particular – fear and greed – tend to drive trading decisions off course.