![]() Rick Wright
Rick Wright
Online Trading Academy
Hello traders! This week’s newsletter will explain the power of using higher time frames in your trades.
One of the great things about being an instructor for Online Trading Academy is that I get to meet people from all walks of life and from nearly every industry that exists. I enjoy the diversity of people! However, one thing that seems to be somewhat common is the perception that traders/investors NEED to spend a lot of their time staring at their computer screens to be successful in trading. I strongly disagree with this!
Several famous traders made comments pointing out that, the money is made in the waiting. In fact, some of the most successful traders lie in wait for the chosen trading instrument to get to a favorable price level on the chart, and then pounce. Then they lie in wait for days or weeks or even months as the price goes in their chosen direction. Once in a position, their only action is to manage a stop loss to lock in profits over this trade.
The Problem with Small Time Frame Charts
One thing that has become apparent to me and many other experienced traders is that charts are fractal, meaning that a 1-minute chart will behave in nearly the same way as a daily chart. One of the problems with using a small-time frame chart is the fact that the smaller the time frame, the more computers/bots/algorithms you are trading against! When you understand that these computer bots might be in a trade for only a few seconds or minutes and their position sizes can be huge, most retail traders can’t compete with those machines. The way I describe it is that these computer bot companies have more money than us, faster computers than us and faster internet connections than us. It would be like me (5’ 10”, 175 pounds, 50 + years old) trying to compete in the NBA against someone like LeBron James…doubtful I would score even one point, let alone win!
So, let’s look at a couple of examples of fractals in the market, and the corresponding amount of effort involved in trading them.
In the following 15 minute time frame on the EUR/USD pair, a very short term double top formation can be seen. The short-term trader would look to go short at the blue arrow. With an entry at approximately 1.090, their profit target would normally be about 1.065. An amazing 15 pips! They would also be at or near their computer for the few hours they were in the trade…lots of attention required for 15 pips!

The Benefit of Larger Time Frame Charts
Now, when we look at larger time frames, we are trading with institutions that plan on being in their trades for weeks, months, even quarters at a time. As these huge multinational corporations are hedging their currency risk, I believe they are trying to make sure that they are meeting or exceeding their quarterly earnings estimates to drive their share prices higher and achieve their quarterly/yearly bonuses. If a massive, multinational corporation doesn’t care about making 8 pips on a 1-minute chart, why should we? If they are planning on being in a trade for hundreds or thousands of pips for weeks at a time, I think we should consider following their lead!
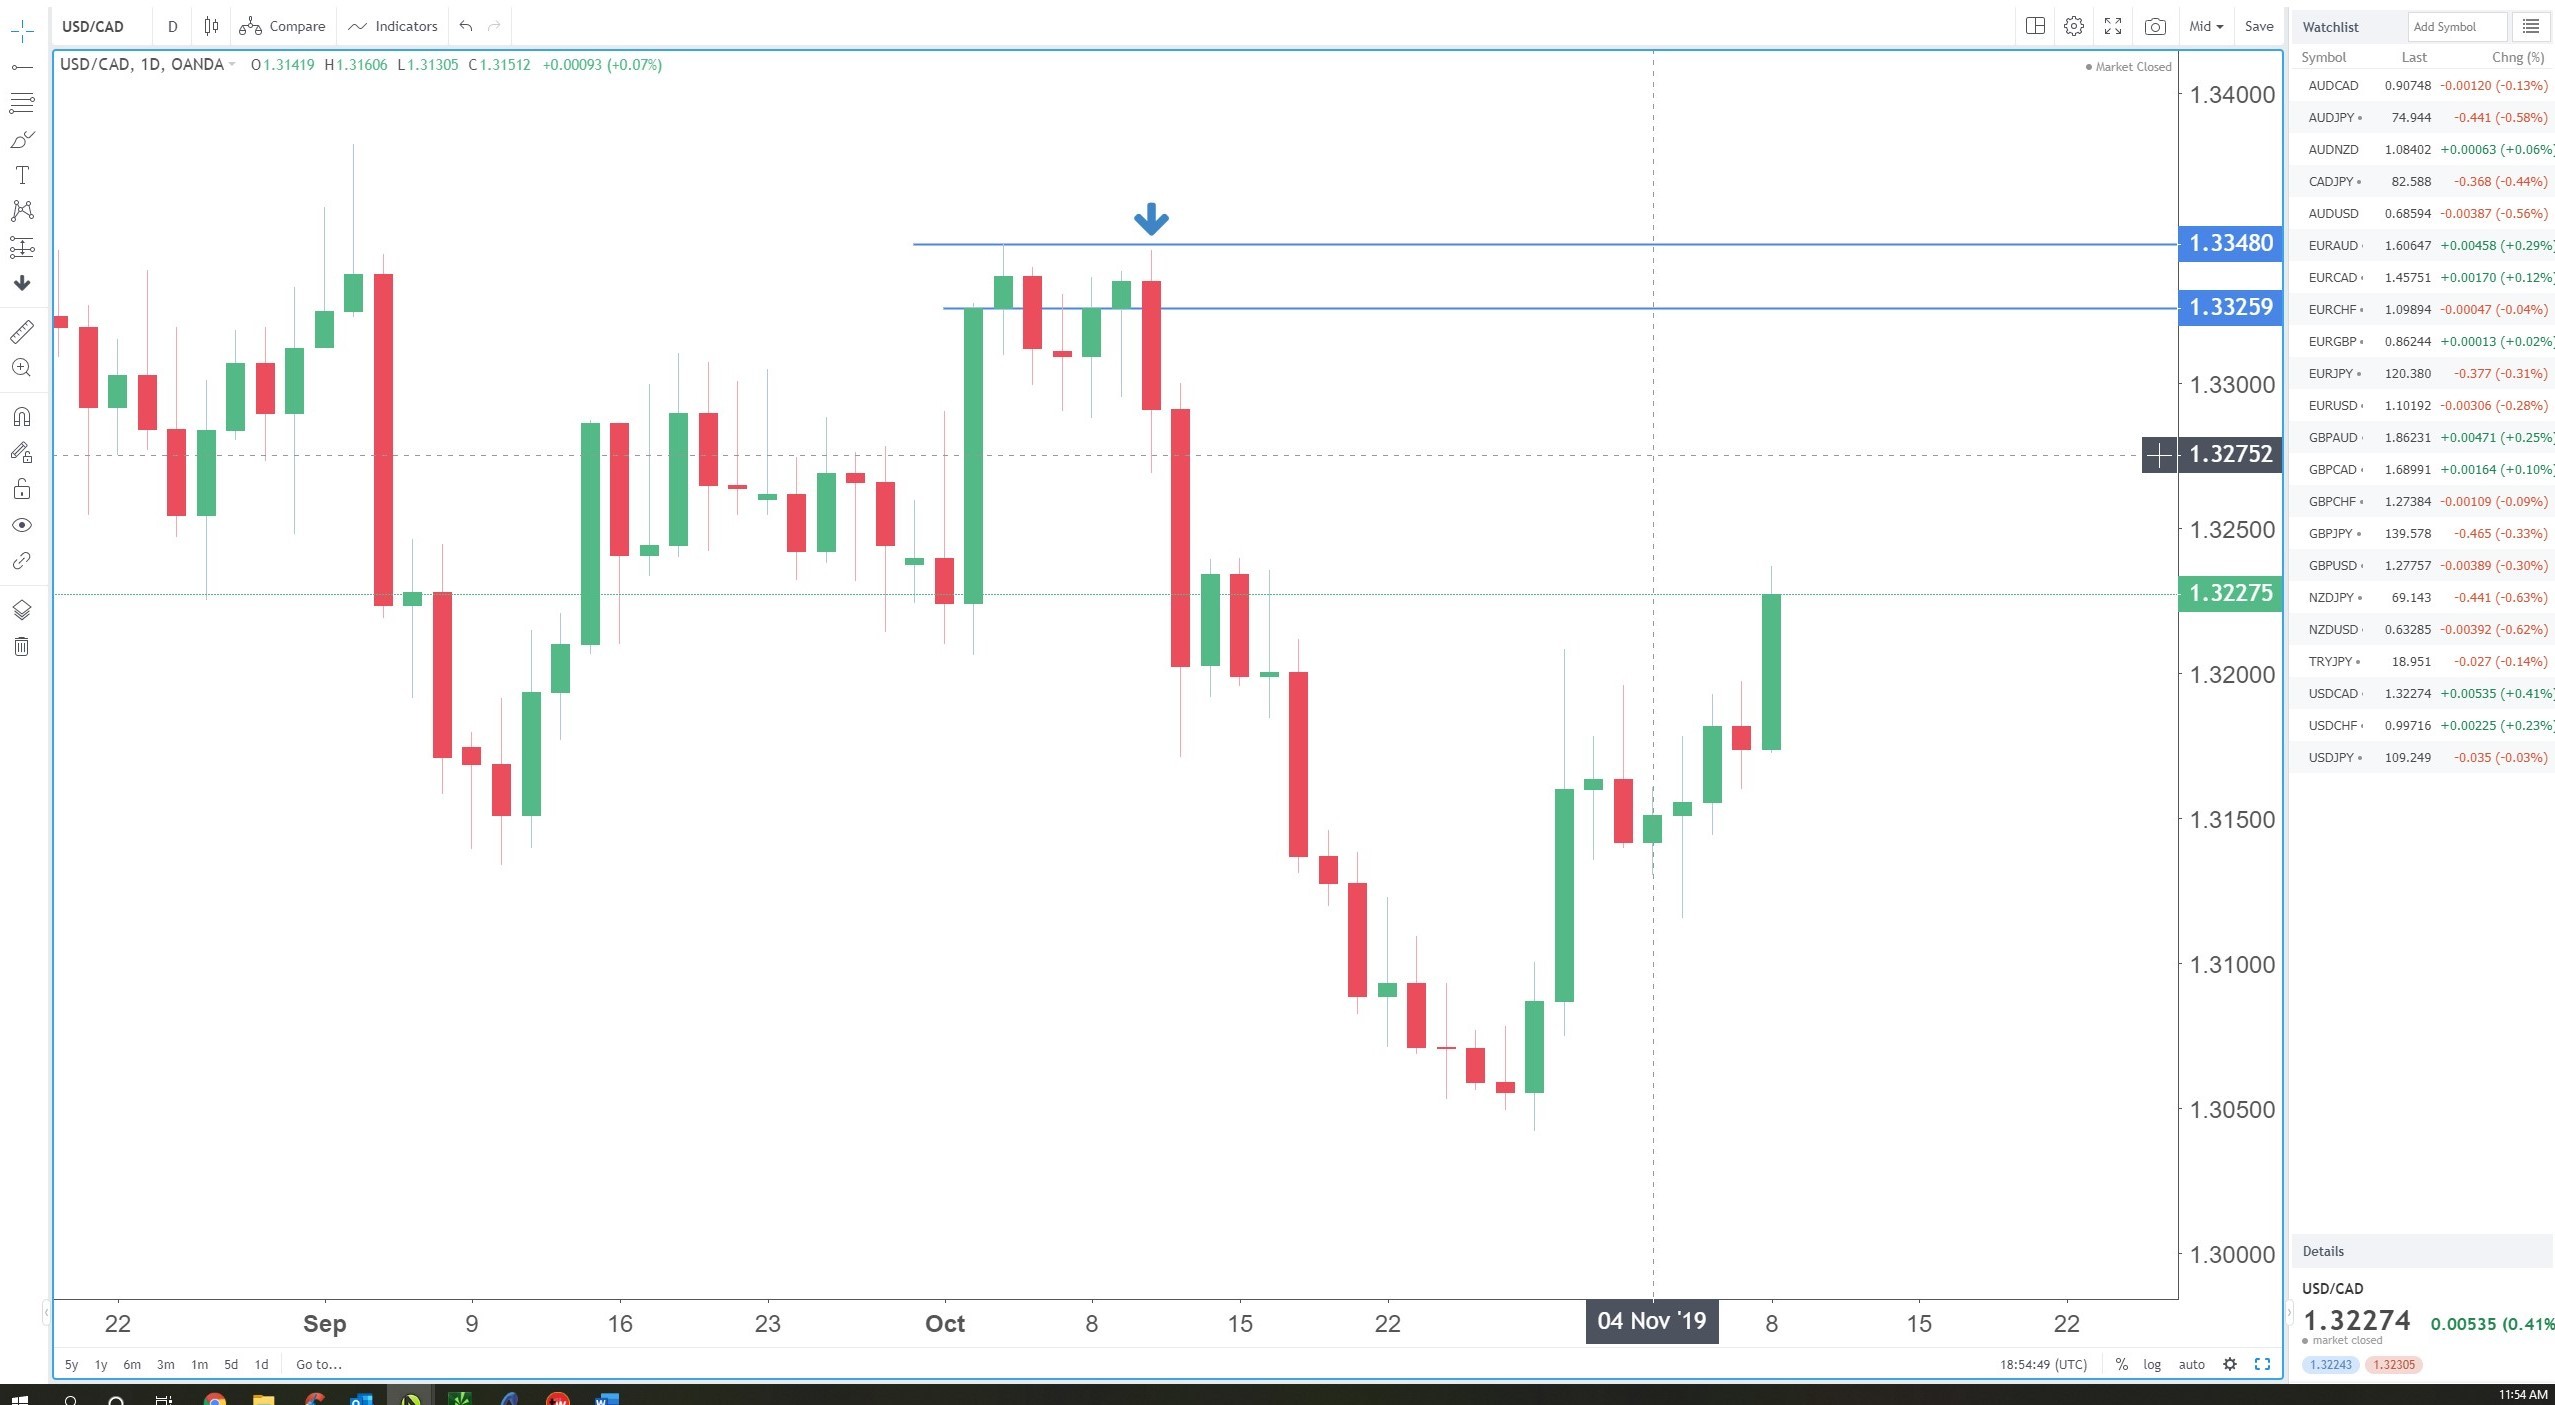
In this next chart, a Daily time frame on the USD/CAD pair, a similar (fractal!) double top has formed. The longer-term trader would enter their short at the blue arrow, around the 1.3326 mark. As you can see, this trade would have produced many more pips! Using any number of trade management techniques, they could have stayed with this trade down to nearly the 1.3100 level. This should have given them over two hundred pips over about two week’s worth of time…
One of the great things about being in a trade that is going your direction is the lack of trader involvement or attention needed to manage this trade! Every day or two we would expect you to move your stop loss on down, first to break even, then to lock in profits as the trade progressed. How much time does it take to adjust your stop loss? Merely seconds. A few seconds to see if you SHOULD move your stop, a few seconds to see WHERE you should move your stop, and then a couple seconds to actually MOVE the stop. Again, the big pips are made in the waiting, and letting the institutions do their work.
One last thing. When in a trade for days or weeks at a time, one of the worst things you can do is check it every few minutes! This opens up the difficult side of trading: the emotional attachment to the pips on the screen! Imagine you were up 100 pips, then only up 75 pips, then only 20 pips and the emotions you would be feeling. What does the normal retail trader do in that situation? They take themselves out of the trade just to capture that small profit. Invariably, the chart then goes back in their direction, causing them to kick themselves, or even worse, jump back in the trade! We call this chasing the trade. Please don’t do that! If you don’t watch your trade too closely, those small time-frame emotions won’t interfere with your judgement process. Again, often the money is made in the waiting, not the watching!
This content is intended to provide educational information only. This information should not be construed as individual or customized legal, tax, financial or investment services. As each individual's situation is unique, a qualified professional should be consulted before making legal, tax, financial and investment decisions. The educational information provided in this article does not comprise any course or a part of any course that may be used as an educational credit for any certification purpose and will not prepare any User to be accredited for any licenses in any industry and will not prepare any User to get a job. Reproduced by permission from OTAcademy.com click here for Terms of Use: https://www.otacademy.com/about/terms
Editors’ Picks

EUR/USD hits two-day highs near 1.1820
EUR/USD picks up pace and reaches two-day tops around 1.1820 at the end of the week. The pair’s move higher comes on the back of renewed weakness in the US Dollar amid growing talk that the Fed could deliver an interest rate cut as early as March. On the docket, the flash US Consumer Sentiment improves to 57.3 in February.

GBP/USD reclaims 1.3600 and above
GBP/USD reverses two straight days of losses, surpassing the key 1.3600 yardstick on Friday. Cable’s rebound comes as the Greenback slips away from two-week highs in response to some profit-taking mood and speculation of Fed rate cuts. In addition, hawkish comments from the BoE’s Pill are also collaborating with the quid’s improvement.

USD/JPY drops back below 157.00, as focus shifts to Japan snap election
USD/JPY is back in the red below 157.00 in the Asian session on Friday. The Japanese Yen recovers ground against the US Dollar amid some profit-taking ahead of Japan's snap general election on Sunday. The preliminary reading of the Michigan Consumer Sentiment Index report for February will be released later on Friday.
Editors’ Picks

EUR/USD: US Dollar to remain pressured until uncertainty fog dissipates Premium
The EUR/USD pair lost additional ground in the first week of February, settling at around 1.1820. The reversal lost momentum after the pair peaked at 1.2082 in January, its highest since mid-2021.

Gold: Volatility persists in commodity space Premium
After losing more than 8% to end the previous week, Gold (XAU/USD) remained under heavy selling pressure on Monday and dropped toward $4,400. Although XAU/USD staged a decisive rebound afterward, it failed to stabilize above $5,000.

GBP/USD: Pound Sterling tests key support ahead of a big week Premium
The Pound Sterling (GBP) changed course against the US Dollar (USD), with GBP/USD giving up nearly 200 pips in a dramatic correction.

Bitcoin: The worst may be behind us
Bitcoin (BTC) price recovers slightly, trading at $65,000 at the time of writing on Friday, after reaching a low of $60,000 during the early Asian trading session. The Crypto King remained under pressure so far this week, posting three consecutive weeks of losses exceeding 30%.

Three scenarios for Japanese Yen ahead of snap election Premium
The latest polls point to a dominant win for the ruling bloc at the upcoming Japanese snap election. The larger Sanae Takaichi’s mandate, the more investors fear faster implementation of tax cuts and spending plans.
RECOMMENDED LESSONS
Making money in forex is easy if you know how the bankers trade!
I’m often mystified in my educational forex articles why so many traders struggle to make consistent money out of forex trading. The answer has more to do with what they don’t know than what they do know. After working in investment banks for 20 years many of which were as a Chief trader its second knowledge how to extract cash out of the market.
5 Forex News Events You Need To Know
In the fast moving world of currency markets where huge moves can seemingly come from nowhere, it is extremely important for new traders to learn about the various economic indicators and forex news events and releases that shape the markets. Indeed, quickly getting a handle on which data to look out for, what it means, and how to trade it can see new traders quickly become far more profitable and sets up the road to long term success.
Top 10 Chart Patterns Every Trader Should Know
Chart patterns are one of the most effective trading tools for a trader. They are pure price-action, and form on the basis of underlying buying and selling pressure. Chart patterns have a proven track-record, and traders use them to identify continuation or reversal signals, to open positions and identify price targets.
7 Ways to Avoid Forex Scams
The forex industry is recently seeing more and more scams. Here are 7 ways to avoid losing your money in such scams: Forex scams are becoming frequent. Michael Greenberg reports on luxurious expenses, including a submarine bought from the money taken from forex traders. Here’s another report of a forex fraud. So, how can we avoid falling in such forex scams?
What Are the 10 Fatal Mistakes Traders Make
Trading is exciting. Trading is hard. Trading is extremely hard. Some say that it takes more than 10,000 hours to master. Others believe that trading is the way to quick riches. They might be both wrong. What is important to know that no matter how experienced you are, mistakes will be part of the trading process.
The challenge: Timing the market and trader psychology
Successful trading often comes down to timing – entering and exiting trades at the right moments. Yet timing the market is notoriously difficult, largely because human psychology can derail even the best plans. Two powerful emotions in particular – fear and greed – tend to drive trading decisions off course.