![]() Russ Allen
Russ Allen
Online Trading Academy
The next few articles will be about using the Option P/L Graph. This is a tool built into every option trading platform. Most option traders know it is there, but not all fully understand its use or its importance.
Today’s examples will be the simplest possible ones. We’ll progress from these to more sophisticated ones in future articles.
The example today depicts a trade on a particular option: called a Call option, at a strike price of $273 on shares of the exchange-traded fund SPY.
SPY was trading around $273. The price of the 273 call, expiring in a few days on June 15, 2018 was $325 per option contract at the time. So, $325 would be the amount paid by any option buyer to the option seller in this trade. Assume that to begin with, neither the buyer nor the seller of the call had any position in the shares of SPY itself – the option position alone is the entire position for each of them.
Below are two graphs of the trade. The first graph represents the profit or loss on the trade that would be experienced by the option buyer, if the position was held until expiration. The second graph represents the profit or loss experienced by the seller of that same option. Everything but the essentials has been removed from the graphs.
The horizontal axis is labeled Underlying Price. On option P/L graphs we read stock price from left to right, rather than from bottom to top.
The vertical axis is labelled Theo Value P/L (Theoretical Value Profit or Loss).
The blue line on each graph relates the profit or loss on the trade at a particular date, in this case the expiration date of 06/15/18, to any given price of the stock at that time.
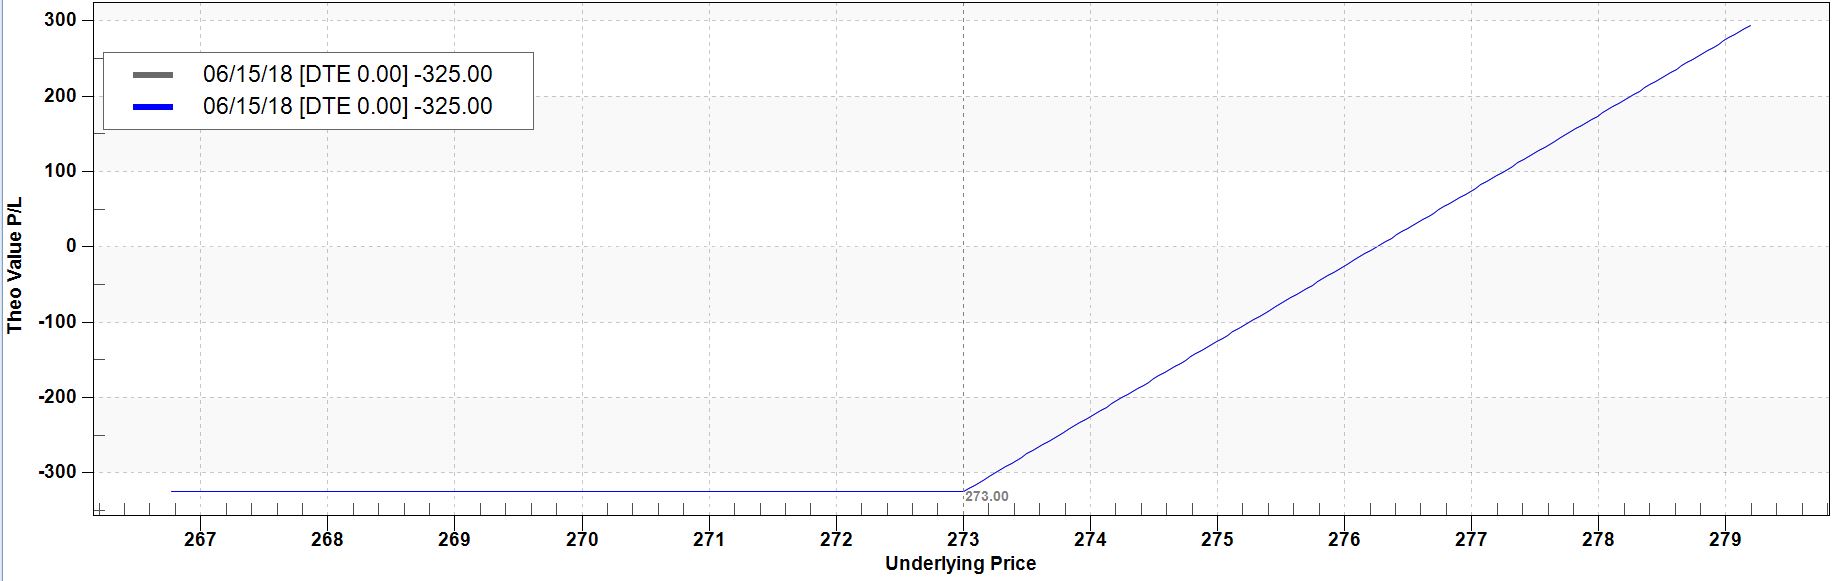
Note what is similar about the two graphs. On each one, there is a horizontal section of the blue P/L line. Looking at the blue line from left to right, it is flat from the left side of the graph up to the point where Underlying Price equals 273.
Now look at the value on the left-hand scale next to the horizontal blue lines.
On the first graph (the buyer’s), the value is a little below -$300. To be precise, it is at -$325. What this means in practical terms is that, if at expiration of the call the value of the stock is below the $273 strike price, then the call will be worthless; and because the call buyer originally paid $325 for the call and he now receives nothing, his P/L would be a loss of the full purchase price of $325.
Now look at the second graph. The value on the P/L axis at the horizontal line section is a little above +$300. To be precise, once again, it is at +$325. This means the same thing that it did for the call buyer, but in reverse: if the stock is at any price below the $273 strike at expiration, then the 273 call will be worthless. This is the best case for the call seller. He will have been paid $325 for something that subsequently became worthless. He does not need to take any action to terminate the trade. The option expires and he has a clear profit equal to the $325 that he originally received.
So, in any case where the stock on expiration day is below $273, then the score is Option buyer $-325, Option Seller +$325.
Now look to the right side of that $273 Underlying Price, first on the buyer’s graph. In particular, find $276 on the Underlying Price scale. Look up the dotted vertical line at 276 until you locate the intersection with the blue line. Now look left from that point to see at what position that intersection is on the left scale. You’ll find that it is a little below zero. To be exact, it is at -$25.
Think about the value of the call if SPY were to be at $276 at expiration. In that case, the 273 call would not be worthless. It would then be the right to buy 100 shares at a $3.00 discount per share ($276 market price less $273 strike price). This discount to market value would be the intrinsic value of the call in that case. (At expiration, every option is worth exactly its intrinsic value). The call buyer at that time could recover the $300 intrinsic value in one of two ways. He could either sell the call for $300; or he could exercise the call and then sell the stock for a $300 profit. Same result either way. In either case, he would have salvaged $300 of his original call purchase price of $325, and so would have a $25 net loss. Hence the value shown on the Theoretical P//L scale of $-25.
Now do the same for the second (seller’s) graph. Notice that at an Underlying price of $276, the value for Theo Value P/L is a little above zero. It is at +$25 to be exact.
Since with the stock at $276, the intrinsic value of the call is ($276 – $273) X 100 = $300 (same as in the buyer’s case), the call seller must now pay $300 to terminate the trade. Once again, this can happen in one of two ways. First, if the call seller does nothing, the option will be exercised. All in-the-money options are automatically exercised at expiration. In that case he will be forced to buy the shares at their market value of $276, so that he can meet his obligation to deliver the stock in exchange for $273 in cash. He loses $3 per share ($276 market price paid, less $273 received upon exercise), times 100 shares, for a total of $300 out of pocket.
Alternatively, the call seller could just buy back the call for its $300 market value just before expiration, which would also negate his obligation to deliver the stock. Either way, he is out of pocket by $300.
Since the call seller originally received $325 for the call, and he must now pay $300 of that back to extract himself from the trade, he has a net profit of $325 – $300 = $25.
So, in the case where the stock ends up at $276 at expiration, the score is Call Seller +$25, Call Buyer -$25.
If you follow the same process at a higher Underlying Price, say, 279, you’ll find that the score is Call Seller -$275, Call Buyer +$275.
In fact, no matter what the price of the stock might be at the point in time depicted by the blue line (expiration), whatever the call buyer’s profit or loss is, the call seller’s is equal and opposite.
In graphic terms, imagine a horizontal line at the zero P/L level, drawn from left to right across each graph. Now imagine the chart being rotated top-to-bottom around that horizontal line. After the rotation, the graph is now that of the other player. The buyer’s graph becomes the seller’s, or vice-versa. This is proof that this option trade (and every option trade) is a zero-sum game, with one player’s gain exactly equaling the other’s loss. Their positions are mirror images of each other, with the edge of the mirror on the zero P/L line.
If you are interested in options, take the time to study and understand these two graphs. Make sure these points are clear:
-
A situation where an option is worthless is the best case for the seller, because the seller keeps the whole amount originally received for the option as clear profit. This shows on a P/L graph as a horizontal line at a positive P/L value equal to the credit received.
-
That is also the worst case for the buyer, who loses everything he paid. On his graph, this appears as a horizontal line at a negative value, equal to the debit paid.
-
If the option is not worthless at expiration, then the buyer can recover some of what he paid, or maybe more than he paid. Whatever he realizes from the option in that case in effect comes out of the pocket of the option seller. There is no limit on how much this could be. The option buyer’s potential profit is unlimited; his P/L graph extends upward off the chart. The same is true in reverse for the seller, showing that his maximum loss is unlimited.
So far, in this example we have only looked at the situation as it would exist at one particular moment in time – the moment of expiration. In future articles we will see how the P/L graphs portray the situation at different future times.
This content is intended to provide educational information only. This information should not be construed as individual or customized legal, tax, financial or investment services. As each individual's situation is unique, a qualified professional should be consulted before making legal, tax, financial and investment decisions. The educational information provided in this article does not comprise any course or a part of any course that may be used as an educational credit for any certification purpose and will not prepare any User to be accredited for any licenses in any industry and will not prepare any User to get a job. Reproduced by permission from OTAcademy.com click here for Terms of Use: https://www.otacademy.com/about/terms
Editors’ Picks

EUR/USD hits two-day highs near 1.1820
EUR/USD picks up pace and reaches two-day tops around 1.1820 at the end of the week. The pair’s move higher comes on the back of renewed weakness in the US Dollar amid growing talk that the Fed could deliver an interest rate cut as early as March. On the docket, the flash US Consumer Sentiment improves to 57.3 in February.

GBP/USD reclaims 1.3600 and above
GBP/USD reverses two straight days of losses, surpassing the key 1.3600 yardstick on Friday. Cable’s rebound comes as the Greenback slips away from two-week highs in response to some profit-taking mood and speculation of Fed rate cuts. In addition, hawkish comments from the BoE’s Pill are also collaborating with the quid’s improvement.

USD/JPY drops back below 157.00, as focus shifts to Japan snap election
USD/JPY is back in the red below 157.00 in the Asian session on Friday. The Japanese Yen recovers ground against the US Dollar amid some profit-taking ahead of Japan's snap general election on Sunday. The preliminary reading of the Michigan Consumer Sentiment Index report for February will be released later on Friday.
Editors’ Picks

EUR/USD: US Dollar to remain pressured until uncertainty fog dissipates Premium
The EUR/USD pair lost additional ground in the first week of February, settling at around 1.1820. The reversal lost momentum after the pair peaked at 1.2082 in January, its highest since mid-2021.

Gold: Volatility persists in commodity space Premium
After losing more than 8% to end the previous week, Gold (XAU/USD) remained under heavy selling pressure on Monday and dropped toward $4,400. Although XAU/USD staged a decisive rebound afterward, it failed to stabilize above $5,000.

GBP/USD: Pound Sterling tests key support ahead of a big week Premium
The Pound Sterling (GBP) changed course against the US Dollar (USD), with GBP/USD giving up nearly 200 pips in a dramatic correction.

Bitcoin: The worst may be behind us
Bitcoin (BTC) price recovers slightly, trading at $65,000 at the time of writing on Friday, after reaching a low of $60,000 during the early Asian trading session. The Crypto King remained under pressure so far this week, posting three consecutive weeks of losses exceeding 30%.

Three scenarios for Japanese Yen ahead of snap election Premium
The latest polls point to a dominant win for the ruling bloc at the upcoming Japanese snap election. The larger Sanae Takaichi’s mandate, the more investors fear faster implementation of tax cuts and spending plans.
RECOMMENDED LESSONS
Making money in forex is easy if you know how the bankers trade!
I’m often mystified in my educational forex articles why so many traders struggle to make consistent money out of forex trading. The answer has more to do with what they don’t know than what they do know. After working in investment banks for 20 years many of which were as a Chief trader its second knowledge how to extract cash out of the market.
5 Forex News Events You Need To Know
In the fast moving world of currency markets where huge moves can seemingly come from nowhere, it is extremely important for new traders to learn about the various economic indicators and forex news events and releases that shape the markets. Indeed, quickly getting a handle on which data to look out for, what it means, and how to trade it can see new traders quickly become far more profitable and sets up the road to long term success.
Top 10 Chart Patterns Every Trader Should Know
Chart patterns are one of the most effective trading tools for a trader. They are pure price-action, and form on the basis of underlying buying and selling pressure. Chart patterns have a proven track-record, and traders use them to identify continuation or reversal signals, to open positions and identify price targets.
7 Ways to Avoid Forex Scams
The forex industry is recently seeing more and more scams. Here are 7 ways to avoid losing your money in such scams: Forex scams are becoming frequent. Michael Greenberg reports on luxurious expenses, including a submarine bought from the money taken from forex traders. Here’s another report of a forex fraud. So, how can we avoid falling in such forex scams?
What Are the 10 Fatal Mistakes Traders Make
Trading is exciting. Trading is hard. Trading is extremely hard. Some say that it takes more than 10,000 hours to master. Others believe that trading is the way to quick riches. They might be both wrong. What is important to know that no matter how experienced you are, mistakes will be part of the trading process.
The challenge: Timing the market and trader psychology
Successful trading often comes down to timing – entering and exiting trades at the right moments. Yet timing the market is notoriously difficult, largely because human psychology can derail even the best plans. Two powerful emotions in particular – fear and greed – tend to drive trading decisions off course.