![]() Russ Allen
Russ Allen
Online Trading Academy
I have referred often in these articles to the Options Profit Loss graph. Today, I want to show it explicitly and discuss its uses.
First, let’s look not at an option Profit Loss graph, but at a regular price chart of a stock to use an example. I’ve chosen Colgate Palmolive (symbol CL).
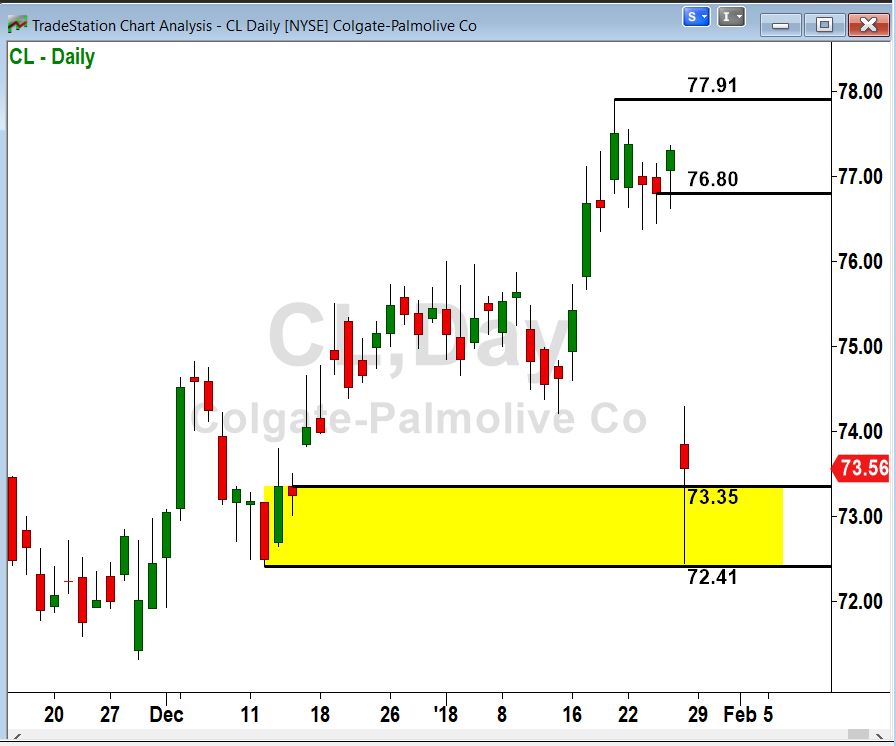
On this date, Colgate had just reported in-line earnings but disappointing sales, and its stock price had dropped by over 6% in a single day.
In cases of earnings surprises like this, it is often true that the immediate move is an overreaction that will be reversed in the near future. This could very well be one of those cases. The stock seemed to have stopped its plunge and begun righting itself.
To capitalize on the rebound move, we could have bought call options. These would increase in value if Colgate stock went back up. Checking the option chain, we found that the May call at the $70 strike could be bought for $4.875 per share ($487.50 per option contract).
How much might we expect to make if we bought those calls and were right about CL regaining its pre-earnings price in the near future?
Answering that question requires an options profit loss graph. Although we know that a call option will go up in value when its underlying stock does, the movement is not linear. There is no back-of-the envelope way to calculate what an option price will be after a move in the stock price. We need the mathematical horsepower of the option profit loss graph to do it. All trading platforms provide some version of this tool. The details of their operations are a little different, but all are basically similar in their function.
That function is to show us how much money could be made or lost on an option position, when its underlying stock moves to a different price.
Below is the option P/L graph for the May $70 CL Calls, made as of January 28, 2018.

This diagram is actually three P/L graphs (the thin white, purple and cyan lines that slope upward from left to right). Each of the three lines is calculated as of a different date. This is to show that the price of an option is affected not just by stock price, but also by time. I selected the current date (1/28/18, white line); another date about two months away (3/24/18, purple line); and the expiration date (May 18, 2018, cyan line).
The three graphs all take $487.50, the current market value of the option, as its initial cost. Each line plots the profit or loss that would be made on the option if liquidated on the date specified for that line, with the stock at that time at the price indicated on the horizontal axis.
The graphs take a little getting used to, but the effort is well worth it. The stock price, instead of being on the vertical axis like a price chart, is on the horizontal axis. And the vertical axis shows profit or loss from a fixed starting point (the $487.50 current value of the options).
In the table beneath the graph, on the bottom line, is a row of data that would apply if the stock price were to rise to $81.08 today. We can tell this because $81.08 is the amount shown in the first column, labeled Price; and because under the heading “Plot” the value is “Plot 1.” Today’s date (1/28/18) is shown as the first of the three dates in the legend on the chart, in the box (plot number 1). In the “Value” column for this line, the amount shown is $1,142.37. This means that if CL stock were to rise to $81.08 today, the value of our $70 strike call option would be that amount. Since our cost is $487.50, our profit would be $1,142.37 – $487.50, or $654.87. We can see that the amount under the heading “Theo P/L” is $654.87.
I chose $81.08 as an example price, called a price ‘slice,’ just because it was a high price that would be unlikely to be reached today. Notice that there are two other rows of data in the table. These are for the current price ($73.87) and a price that is much lower ($67.30). In fact, you can show as many price slices as you want and specify a different price for each.
On the row whose Price is $67.30, we can see that the Value of the option would be only $110.71. Since our cost was $487.50, that would represent a loss of $487.50 – $110,71, or $376.79. That amount is shown in the “Theo P/L” column for that line.
Usually, we use three slices: one for the price at which the stock is now; one for the stop-loss price, and one for a target price. The Value column then shows us what the value of the option position would be with the stock at each of those prices. We can then evaluate risk vs. reward on the trade to determine if we should take it.
That’s all we have space for today. There is much more that the profit loss graph can do, and we’ll look at some of those features in future articles. If you trade options, be sure to become fluent in the use of the P/L graphing tool that comes with your platform
This content is intended to provide educational information only. This information should not be construed as individual or customized legal, tax, financial or investment services. As each individual's situation is unique, a qualified professional should be consulted before making legal, tax, financial and investment decisions. The educational information provided in this article does not comprise any course or a part of any course that may be used as an educational credit for any certification purpose and will not prepare any User to be accredited for any licenses in any industry and will not prepare any User to get a job. Reproduced by permission from OTAcademy.com click here for Terms of Use: https://www.otacademy.com/about/terms
Editors’ Picks

EUR/USD hits two-day highs near 1.1820
EUR/USD picks up pace and reaches two-day tops around 1.1820 at the end of the week. The pair’s move higher comes on the back of renewed weakness in the US Dollar amid growing talk that the Fed could deliver an interest rate cut as early as March. On the docket, the flash US Consumer Sentiment improves to 57.3 in February.

GBP/USD reclaims 1.3600 and above
GBP/USD reverses two straight days of losses, surpassing the key 1.3600 yardstick on Friday. Cable’s rebound comes as the Greenback slips away from two-week highs in response to some profit-taking mood and speculation of Fed rate cuts. In addition, hawkish comments from the BoE’s Pill are also collaborating with the quid’s improvement.

USD/JPY drops back below 157.00, as focus shifts to Japan snap election
USD/JPY is back in the red below 157.00 in the Asian session on Friday. The Japanese Yen recovers ground against the US Dollar amid some profit-taking ahead of Japan's snap general election on Sunday. The preliminary reading of the Michigan Consumer Sentiment Index report for February will be released later on Friday.
Editors’ Picks

EUR/USD: US Dollar to remain pressured until uncertainty fog dissipates Premium
The EUR/USD pair lost additional ground in the first week of February, settling at around 1.1820. The reversal lost momentum after the pair peaked at 1.2082 in January, its highest since mid-2021.

Gold: Volatility persists in commodity space Premium
After losing more than 8% to end the previous week, Gold (XAU/USD) remained under heavy selling pressure on Monday and dropped toward $4,400. Although XAU/USD staged a decisive rebound afterward, it failed to stabilize above $5,000.

GBP/USD: Pound Sterling tests key support ahead of a big week Premium
The Pound Sterling (GBP) changed course against the US Dollar (USD), with GBP/USD giving up nearly 200 pips in a dramatic correction.

Bitcoin: The worst may be behind us
Bitcoin (BTC) price recovers slightly, trading at $65,000 at the time of writing on Friday, after reaching a low of $60,000 during the early Asian trading session. The Crypto King remained under pressure so far this week, posting three consecutive weeks of losses exceeding 30%.

Three scenarios for Japanese Yen ahead of snap election Premium
The latest polls point to a dominant win for the ruling bloc at the upcoming Japanese snap election. The larger Sanae Takaichi’s mandate, the more investors fear faster implementation of tax cuts and spending plans.
RECOMMENDED LESSONS
Making money in forex is easy if you know how the bankers trade!
I’m often mystified in my educational forex articles why so many traders struggle to make consistent money out of forex trading. The answer has more to do with what they don’t know than what they do know. After working in investment banks for 20 years many of which were as a Chief trader its second knowledge how to extract cash out of the market.
5 Forex News Events You Need To Know
In the fast moving world of currency markets where huge moves can seemingly come from nowhere, it is extremely important for new traders to learn about the various economic indicators and forex news events and releases that shape the markets. Indeed, quickly getting a handle on which data to look out for, what it means, and how to trade it can see new traders quickly become far more profitable and sets up the road to long term success.
Top 10 Chart Patterns Every Trader Should Know
Chart patterns are one of the most effective trading tools for a trader. They are pure price-action, and form on the basis of underlying buying and selling pressure. Chart patterns have a proven track-record, and traders use them to identify continuation or reversal signals, to open positions and identify price targets.
7 Ways to Avoid Forex Scams
The forex industry is recently seeing more and more scams. Here are 7 ways to avoid losing your money in such scams: Forex scams are becoming frequent. Michael Greenberg reports on luxurious expenses, including a submarine bought from the money taken from forex traders. Here’s another report of a forex fraud. So, how can we avoid falling in such forex scams?
What Are the 10 Fatal Mistakes Traders Make
Trading is exciting. Trading is hard. Trading is extremely hard. Some say that it takes more than 10,000 hours to master. Others believe that trading is the way to quick riches. They might be both wrong. What is important to know that no matter how experienced you are, mistakes will be part of the trading process.
The challenge: Timing the market and trader psychology
Successful trading often comes down to timing – entering and exiting trades at the right moments. Yet timing the market is notoriously difficult, largely because human psychology can derail even the best plans. Two powerful emotions in particular – fear and greed – tend to drive trading decisions off course.