Traders can easily get lost among all the technical indicators available for analysis. That’s why I want to show you not only the most popular indicators, but also shed light on the less known indicators which can make a significant difference to your trading analysis. In this article, three less known trading indicators are presented that every trader should know about – The Commodity Channel Index (CCI), the Momentum and the ATR Indicator.
Pre-trend patterns every FX trader should know
Trading indicators for forex traders
1) The Commodity Channel Index (CCI)
The Commodity Channel Index (CCI), developed by Donald Lambert in the eighties, is an oscillating indicator which measures the deviation of the security’s price against its moving average (MA) and the normal deviation of the moving average. Despite the name, the CCI indicator can successfully be used with various security types like stocks, currencies and indices. As it measures the current price relative to the moving average of the price, CCI increases in value when the price is far above the its average, and decreases in value when the price is far below its average. That’s why CCI can also be used for identifying overbought and oversold conditions.
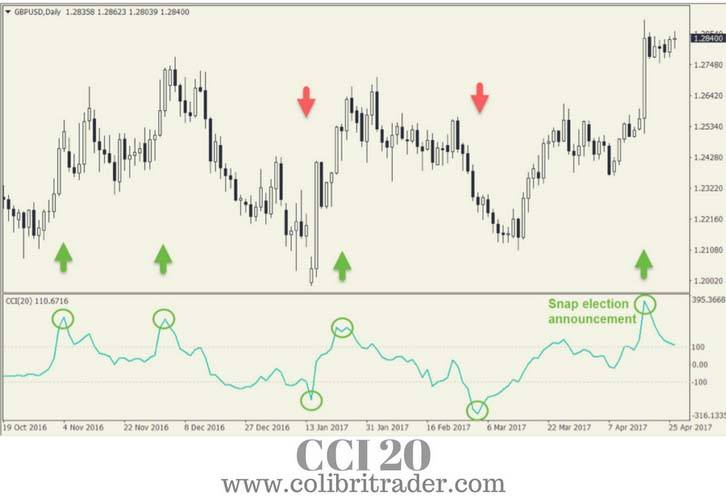
The chart above shows the CCI indicator plotted below the GBP/USD daily chart. It uses a 20-day period which a common period used with the CCI. This means that each new calculation is based on the 20 most recent days for calculating the average price of the pair. Other common periods used in conjunction with CCI are 30 and 40, which generate a less volatile indicator to price changes. The longer the periods, the less often the value of CCI will move outside -100 and +100.
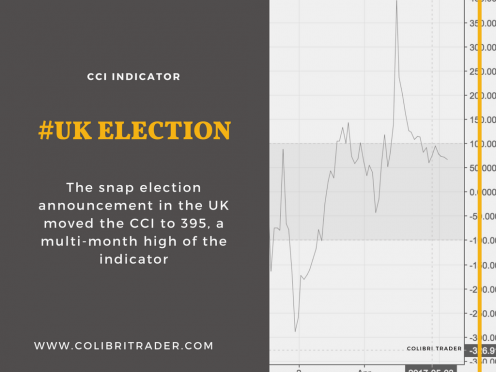
Notice how the CCI remains for most of the time inside the -100 and +100 range in the chart. Lambert used a constant of 0.015 in the CCI calculation to ensure the indicator falls between this range 75% of the time. Values higher than +100 and lower than -100 are showing extreme strength or weakness in the market. The snap election announcement in the UK moved the CCI to 395, a multi-month high of the indicator for the GBP/USD chart.
- Tip: The most common CCI strategy is to enter long positions when the CCI moves above +100, indicating a strong move up in the price, and to enter short positions when the indicator moves below -100.
2) Momentum Indicator
The Momentum indicator is a simple technical indicator of the oscillator family, which compares the most recent closing price to a single previous closing price. It shows where the present trading price is in relation to a price in previous sessions.
The previous closing price is determined by the indicator’s setting, for example a 10-period Momentum indicator compares the present closing price with the closing price 10 periods ago. Hence, if the closing price of the most recent period is higher than n-periods ago, the value of the indicator will be positive. If the most recent closing price is lower, the Momentum indicator will be negative.
Hint: There are two versions of the indicator: the first one shows the difference of closing prices in absolute terms, and the second shows the difference in percentage terms.
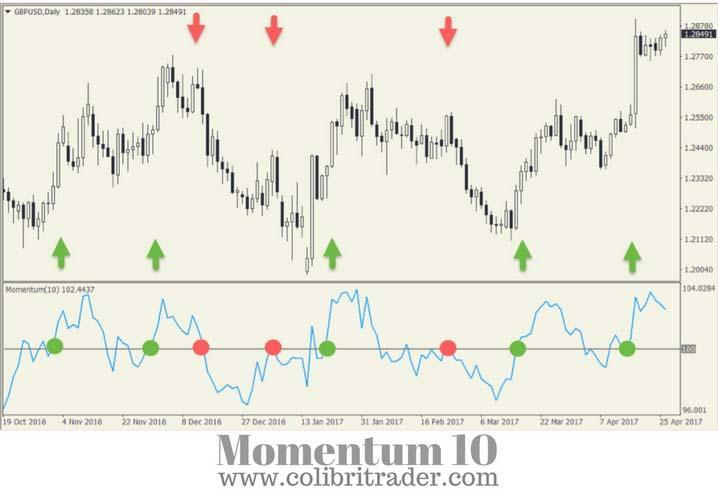
The chart above shows the Momentum indicator on the same GBP/USD pair used for previous examples, so traders can compare the difference in indicator values. The used setting is a 10-period indicator, which in this case means the recent closing price is compared to the closing price 10 days ago.
-
Important: If the recent closing price is higher than the one compared, the Momentum indicator will move above the zero-line (which is plotted at the value of 100). If the recent closing price is lower than the closing price 10 days ago, the indicator will move below 100. The greater the compared difference between the closing prices, the greater the distance will be from the zero-line.
-
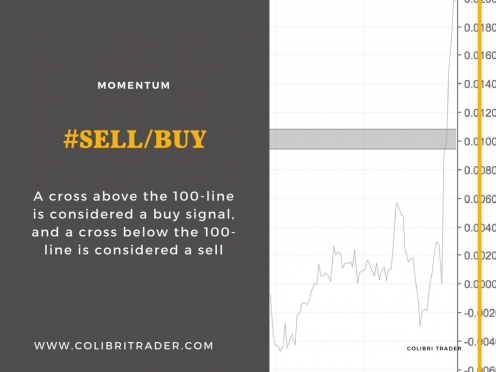
Hint: A simple trading strategy based on the Momentum indicator is the zero-line crossover. A cross above the 100-line is considered a buy signal, and a cross below the 100-line is considered a sell signal.
Usually, much of the price move will already happen when the indicator crosses the zero-line. False signals also appear often with the Momentum indicator. To prevent these drawbacks, it is possible to add a moving average of the indicator and to buy when the indicator crosses the MA from below, and sell when it crosses from above.
3) The ATR Indicator
Like the CCI indicator, the Average True Range was originally developed for commodities, but is also widely used for stocks, currencies, ETFs and other securities. The ATR indicator measures the price volatility of previous highs and lows in absolute terms. The recommended ATR setting is 14-periods on a daily time-frame. Generally, the ATR will have higher values for more volatile instruments with broader price movements. Contrary, a lower ATR value means the price is moving mostly sideways. The ATR can also be used as a confirmation for bullish or bearish reversals. A growing ATR value in the beginning of a reversal might be used as a confirmation signal, as it shows rising momentum of long or short positions.
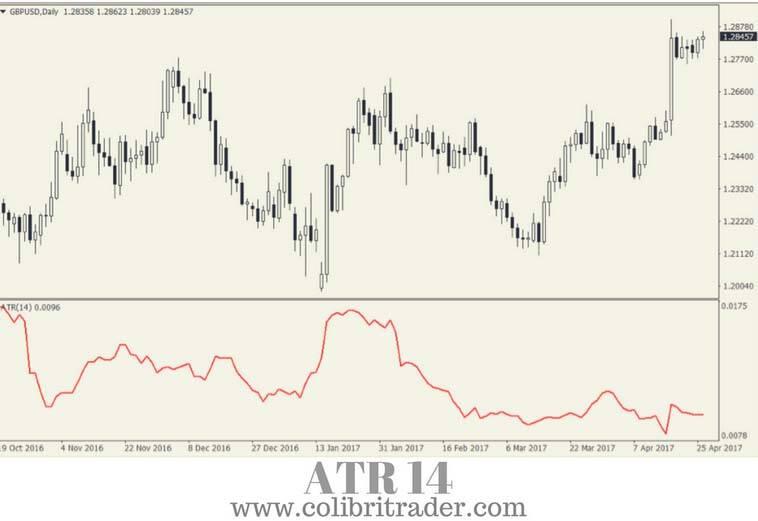
This chart shows the ATR indicator on the GBP/USD pair. As it is a volatility indicator, it doesn’t provide the information where the price is heading. Therefore, its primary use is for assessing the recent volatility change of a security or currency pair. Although ATR does not consider the price direction of the instrument, it can be useful for spotting potential reversals.
- Tip: Higher ATR readings can be followed by reversals, as underlying momentum is building up. But traders need to use additional signals to confirm the reversal.
Another popular use of the ATR is for assessing the required exit level in terms of underlying volatility. A simple volatility ratio can be calculated by dividing the current ATR reading with the current price. A relative higher volatility ratio would require a wider stop-loss, as the price makes greater up and down moves. A ratio is used because higher priced instruments have a greater impact on the ATR value than lower priced ones, which makes comparing ATRs between different-priced instruments impossible.
This material is written for educational purposes only. By no means do any of its contents recommend, advocate or urge the buying, selling or holding of any financial instrument whatsoever. Trading and Investing involves high levels of risk. The author expresses personal opinions and will not assume any responsibility whatsoever for the actions of the reader. The author may or may not have positions in Financial Instruments discussed in this newsletter. Future results can be dramatically different from the opinions expressed herein. Past performance does not guarantee future results.
Editors’ Picks

EUR/USD hits two-day highs near 1.1820
EUR/USD picks up pace and reaches two-day tops around 1.1820 at the end of the week. The pair’s move higher comes on the back of renewed weakness in the US Dollar amid growing talk that the Fed could deliver an interest rate cut as early as March. On the docket, the flash US Consumer Sentiment improves to 57.3 in February.

GBP/USD reclaims 1.3600 and above
GBP/USD reverses two straight days of losses, surpassing the key 1.3600 yardstick on Friday. Cable’s rebound comes as the Greenback slips away from two-week highs in response to some profit-taking mood and speculation of Fed rate cuts. In addition, hawkish comments from the BoE’s Pill are also collaborating with the quid’s improvement.

USD/JPY drops back below 157.00, as focus shifts to Japan snap election
USD/JPY is back in the red below 157.00 in the Asian session on Friday. The Japanese Yen recovers ground against the US Dollar amid some profit-taking ahead of Japan's snap general election on Sunday. The preliminary reading of the Michigan Consumer Sentiment Index report for February will be released later on Friday.
Editors’ Picks

EUR/USD: US Dollar to remain pressured until uncertainty fog dissipates Premium
The EUR/USD pair lost additional ground in the first week of February, settling at around 1.1820. The reversal lost momentum after the pair peaked at 1.2082 in January, its highest since mid-2021.

Gold: Volatility persists in commodity space Premium
After losing more than 8% to end the previous week, Gold (XAU/USD) remained under heavy selling pressure on Monday and dropped toward $4,400. Although XAU/USD staged a decisive rebound afterward, it failed to stabilize above $5,000.

GBP/USD: Pound Sterling tests key support ahead of a big week Premium
The Pound Sterling (GBP) changed course against the US Dollar (USD), with GBP/USD giving up nearly 200 pips in a dramatic correction.

Bitcoin: The worst may be behind us
Bitcoin (BTC) price recovers slightly, trading at $65,000 at the time of writing on Friday, after reaching a low of $60,000 during the early Asian trading session. The Crypto King remained under pressure so far this week, posting three consecutive weeks of losses exceeding 30%.

Three scenarios for Japanese Yen ahead of snap election Premium
The latest polls point to a dominant win for the ruling bloc at the upcoming Japanese snap election. The larger Sanae Takaichi’s mandate, the more investors fear faster implementation of tax cuts and spending plans.
RECOMMENDED LESSONS
Making money in forex is easy if you know how the bankers trade!
I’m often mystified in my educational forex articles why so many traders struggle to make consistent money out of forex trading. The answer has more to do with what they don’t know than what they do know. After working in investment banks for 20 years many of which were as a Chief trader its second knowledge how to extract cash out of the market.
5 Forex News Events You Need To Know
In the fast moving world of currency markets where huge moves can seemingly come from nowhere, it is extremely important for new traders to learn about the various economic indicators and forex news events and releases that shape the markets. Indeed, quickly getting a handle on which data to look out for, what it means, and how to trade it can see new traders quickly become far more profitable and sets up the road to long term success.
Top 10 Chart Patterns Every Trader Should Know
Chart patterns are one of the most effective trading tools for a trader. They are pure price-action, and form on the basis of underlying buying and selling pressure. Chart patterns have a proven track-record, and traders use them to identify continuation or reversal signals, to open positions and identify price targets.
7 Ways to Avoid Forex Scams
The forex industry is recently seeing more and more scams. Here are 7 ways to avoid losing your money in such scams: Forex scams are becoming frequent. Michael Greenberg reports on luxurious expenses, including a submarine bought from the money taken from forex traders. Here’s another report of a forex fraud. So, how can we avoid falling in such forex scams?
What Are the 10 Fatal Mistakes Traders Make
Trading is exciting. Trading is hard. Trading is extremely hard. Some say that it takes more than 10,000 hours to master. Others believe that trading is the way to quick riches. They might be both wrong. What is important to know that no matter how experienced you are, mistakes will be part of the trading process.
The challenge: Timing the market and trader psychology
Successful trading often comes down to timing – entering and exiting trades at the right moments. Yet timing the market is notoriously difficult, largely because human psychology can derail even the best plans. Two powerful emotions in particular – fear and greed – tend to drive trading decisions off course.