![]() Gabe Velázquez
Gabe Velázquez
Online Trading Academy
All markets go through different cycles that produce different psychological effects to those that participate. At the highest point of the market cycle traders and investors feel good about the returns they’ve realized, this is usually followed by a sense of dread when they see those returns begin to dwindle, slowly turning into losses. Unfortunately, this happens more often than not. This is due to the simple fact that most traders and investors don’t have a plan to properly manage risk and thus are subject to their emotions of fear and greed. Moreover, they also don’t have a strategy that helps them time the market. Meaning they don’t know when to get in (buy low) and get out (sell high). As you might imagine, this poses a big challenge for most traders and investors.
In order to deal with some of these challenges a trader/investor must understand the various stages of trading psychology. The caption below illustrates those different psychological phases that both traders and investor go through during various market cycles.
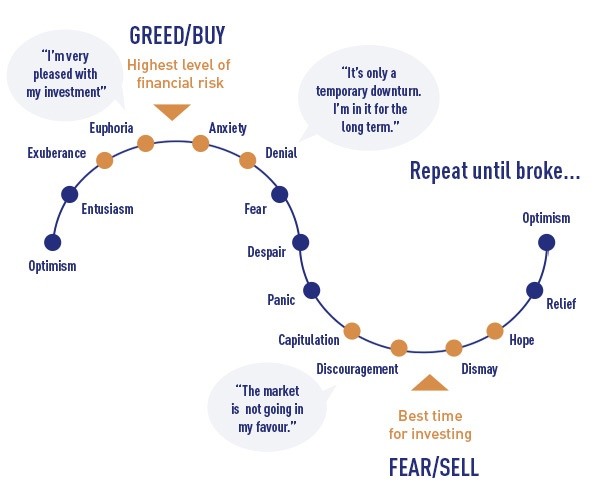
The first phase as the market cycles is optimism. This happens when the market has been in a sustained uptrend for many months and the prospects for earnings and the economy are starting to recover. Traders are feeling comfortable buying as they see little reason to not put some money into the market. As the market continues higher optimism turns into excitement as the earlier buyers are starting to garner profits and every pullback is seen as another buying opportunity. That’s because buyers are being rewarded for purchasing every retracement. As the market accelerates to the upside the “thrill” phase begins as profits increase substantially and investor confidence is through the roof. Then comes the Euphoria phase which is when profits come so easy that most traders and investors feel they must take on leverage and begin to ignore simple risk management principles. Although on the surface it seems like nothing can go wrong, the reality is that this is the point of maximum risk in the cycle, everyone is just too blinded by greed to come to this realization. This phase is where institutional investors have tons of liquidity to unload a bunch of stock as there are huge numbers of willing buyers. This is the distribution phase.
As the new pool of buyers begins to diminish the market starts to rollover. Initially it looks like another garden-variety pullback, that is, until the market fails to take out the prior high watermark and the prior lows are breached. This kicks off the “anxiety’ phase of the cycle as some of those “easy” profits begin to not be so easy anymore. In addition, some of the earlier gains begin to slowly evaporate.
The” denial “phase begins as investors start to rationalize their decisions for holding on to losing trades as good long-term opportunities that will eventually come back. As the market continues lower and the losses continue to mount, denial turns into fear that causes paralysis and confuses traders and investors into doing nothing (like a deer in the headlights).
Persistent selling causes a sense of desperation to take hold among traders and investors as the resolve to hold on for the long term starts to crack. It doesn’t take that much time for panic to set in, as the terrible reality of what the losses mean for every trader is too much to bear. This is the most emotional phase as the pain becomes overwhelming.
With this intensified selling, traders and investors reach their breaking point. This is referred to as the “capitulation” or give-up phase in which traders and investors have to sell to relieve that excruciating pain that they’re in. This is the point of maximum financial opportunity as the institutions are accumulating shares and buying futures contracts for the recovery that most likely is forthcoming.
Invariably, the market does recover after the majority have given up and that causes investors to become despondent and depressed as they realize that they have made a terrible mistake in selling near the lows. This phase is where many question whether they should be traders, or in the markets at all.
Finally, as the market slowly recovers, investors slowly become hopeful again and begin dipping their toes into the water, so to speak. This happens only after a sustained rally is underway of course, and the market cycle begins again.
If we succumb to the emotional roller coaster of investing and trading as pictured in the illustration, we’ll eventually end up broke. Instead, implementing a low-risk, high probability strategy that helps us time the market, and navigate through this emotional cycle is the best course of action. In which phase do you think the market is in today?
Until next time I hope everyone has a great week.
This content is intended to provide educational information only. This information should not be construed as individual or customized legal, tax, financial or investment services. As each individual's situation is unique, a qualified professional should be consulted before making legal, tax, financial and investment decisions. The educational information provided in this article does not comprise any course or a part of any course that may be used as an educational credit for any certification purpose and will not prepare any User to be accredited for any licenses in any industry and will not prepare any User to get a job. Reproduced by permission from OTAcademy.com click here for Terms of Use: https://www.otacademy.com/about/terms
Editors’ Picks

EUR/USD stays depressed near 1.1850 ahead of German ZEW
EUR/USD remains in the red near 1.1850 in the European session on Tuesday. A broad US Dollar bullish consolidation combined with a softer risk tone keep the pair undermined ahead of the German ZEW sentiment survey.

GBP/USD drops below 1.3600 after weak UK jobs report
GBP/USD is seeing a fresh selling wave, giving up the 1.3600 level in Tuesday's European trading. The United Kingdom employment data showed worsening labor market conditions, bolstering bets for a BoE interest rate cut next month. This narrative is weighing heavily on the Pound Sterling.

USD/JPY slides further below 153.00; eyes 200-day EMA amid a firmer JPY
The USD/JPY pair meets with a fresh supply on Tuesday and slides further below the 153.00 mark heading into the European session, reversing a major part of the previous day's positive move. Spot prices, however, manage to hold above the 200-day Exponential Moving Average support, around the 152.50 region, preserving a tentative bullish bias despite a shallow cushion.
Editors’ Picks
GBP/USD drops below 1.3600 after weak UK jobs report
GBP/USD is seeing a fresh selling wave, giving up the 1.3600 level in Tuesday's European trading. The United Kingdom employment data showed worsening labor market conditions, bolstering bets for a BoE interest rate cut next month. This narrative is weighing heavily on the Pound Sterling.
EUR/USD stays depressed near 1.1850 ahead of German ZEW
EUR/USD remains in the red near 1.1850 in the European session on Tuesday. A broad US Dollar bullish consolidation combined with a softer risk tone keep the pair undermined ahead of the German ZEW sentiment survey.

Gold adds to intraday losses as risk-on mood offsets dovish Fed and subdued USD demand
Gold attracts some follow-through selling for the second straight day and dives to over a one-week low, around the $4,858 area, heading into the European session on Tuesday. The commodity, however, quickly recovers to the $4,900 mark as traders opt to await more cues about the US Federal Reserve's (Fed) rate-cut path before placing fresh directional bets.

Pi Network rallies ahead of its first anniversary
Pi Network trades above $0.1800 at the time of writing on Tuesday, recording nearly 5% gains so far. On-chain data indicate that large wallet investors, commonly known as whales, have accumulated approximately 4 million PI tokens over the last 24 hours.

The week ahead: Key inflation readings and why the AI trade could be overdone
It is likely to be a quiet start to the week, with US markets closed on Monday for Presidents Day. European markets are higher across the board and gold is clinging to the $5,000 level after the tamer than expected CPI report in the US reduced haven flows to precious metals.
RECOMMENDED LESSONS
Making money in forex is easy if you know how the bankers trade!
I’m often mystified in my educational forex articles why so many traders struggle to make consistent money out of forex trading. The answer has more to do with what they don’t know than what they do know. After working in investment banks for 20 years many of which were as a Chief trader its second knowledge how to extract cash out of the market.
5 Forex News Events You Need To Know
In the fast moving world of currency markets where huge moves can seemingly come from nowhere, it is extremely important for new traders to learn about the various economic indicators and forex news events and releases that shape the markets. Indeed, quickly getting a handle on which data to look out for, what it means, and how to trade it can see new traders quickly become far more profitable and sets up the road to long term success.
Top 10 Chart Patterns Every Trader Should Know
Chart patterns are one of the most effective trading tools for a trader. They are pure price-action, and form on the basis of underlying buying and selling pressure. Chart patterns have a proven track-record, and traders use them to identify continuation or reversal signals, to open positions and identify price targets.
7 Ways to Avoid Forex Scams
The forex industry is recently seeing more and more scams. Here are 7 ways to avoid losing your money in such scams: Forex scams are becoming frequent. Michael Greenberg reports on luxurious expenses, including a submarine bought from the money taken from forex traders. Here’s another report of a forex fraud. So, how can we avoid falling in such forex scams?
What Are the 10 Fatal Mistakes Traders Make
Trading is exciting. Trading is hard. Trading is extremely hard. Some say that it takes more than 10,000 hours to master. Others believe that trading is the way to quick riches. They might be both wrong. What is important to know that no matter how experienced you are, mistakes will be part of the trading process.
The challenge: Timing the market and trader psychology
Successful trading often comes down to timing – entering and exiting trades at the right moments. Yet timing the market is notoriously difficult, largely because human psychology can derail even the best plans. Two powerful emotions in particular – fear and greed – tend to drive trading decisions off course.