![]() Sam Seiden
Sam Seiden
Independent Analyst
The goal for most traders is consistent profits, an income stream for life from speculating in markets. The key word in that sentence is consistent. Anyone can have profitable trades here and there, but do they produce consistent income and profits from trading. To attain this, you must be able to answer two questions and clearly see the answers on any and all price charts. Where will price turn and where will it move to?
To help answer these questions, we focus on profit zone. Without a path for price to move after we enter a position on the chart, there is no trading opportunity. What we are looking for are supply and demand zones with very little activity between them.
There are many supply and demand zones on a chart. Often, there is a very quality supply and demand zone, but that isn’t all we have to look for. If they are too close to each other, that means no trade. Typically, we are looking for opportunities on the chart that offer us at least 5:1 reward to risk to the first target. Often, we are looking for an even higher risk to reward ratio, but this is a safe minimum to make a trade acceptable to take.
Let me explain through trades we took during one of my live trading and analysis sessions for our members.
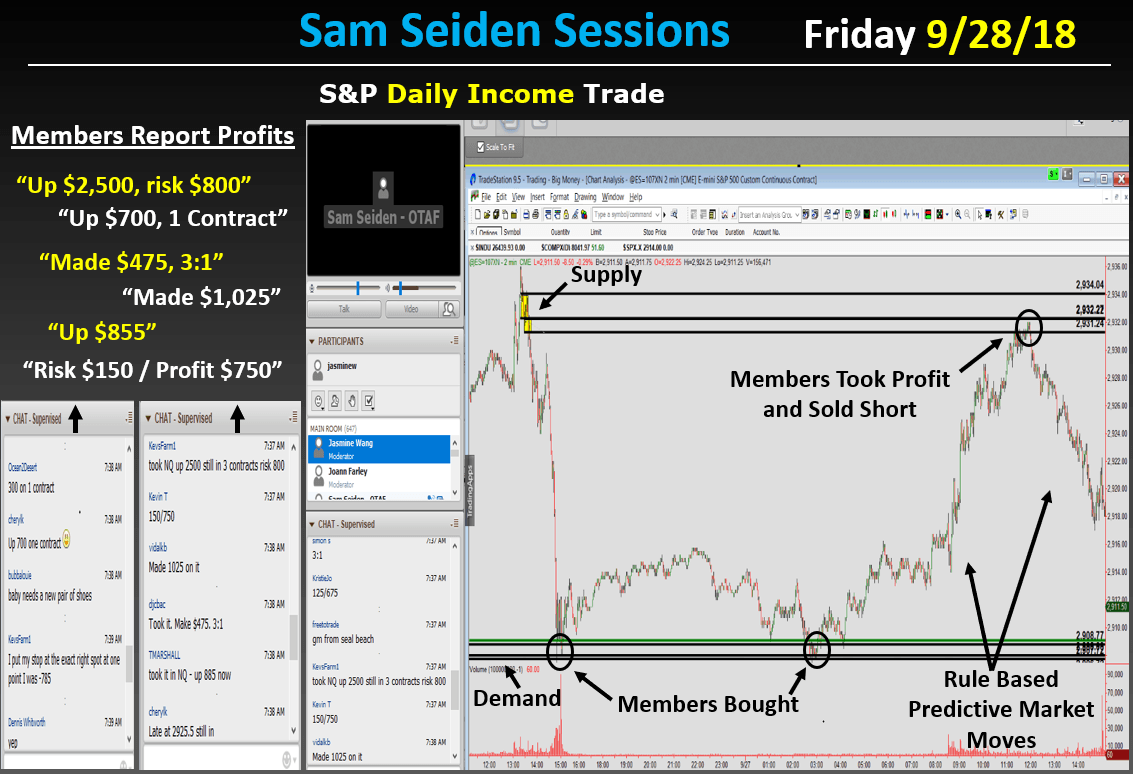
These were two trades in the S&P from last week, buying at demand and selling at supply. Notice the supply zone on the chart, shaded in yellow. The supply zone is the origin of a strong decline in price and has with it some very key Odds Enhancers that make it a significant zone where banks are likely selling, where supply greatly exceeds demand. After buying at demand and price rallying up to that supply, the next trade was to sell short at supply, selling to a novice buyer for a potential move down in price.
Two specific things made this trade work well. First was the quality supply zone. Second, notice the rally that brought price up to the supply zone where we sold short. There was good news, people started buying in a hurry, and price shot up quickly. Notice specifically that there is no picture of demand in that rally. This means that when price reached the supply zone where we sold short, price was likely to fall just as fast as it rallied because there was no significant demand to stop it from falling.
Let’s go over two key pictures on a chart so that you can start seeing this profit picture also:
-
Quality Supply and Demand Zones: To identify market turning points and market moves in advance with a high degree of accuracy, you need to be able to know where financial institutions and banks are buying and selling in the markets. To accomplish this, you must be able to quantify real supply and demand in a market. This answers the question: Where will price turn?
-
A Clear Profit Zone: Just as it is important to identify strong supply and demand zones on a chart, it is equally important to be able to identify areas on the price chart where there is very little supply or demand. These are the areas where price will move quickly through as there is little supply or demand to stop price movement. This answers the question: Where will price move to?
Everything you need to see is on the price charts, if you know what you’re looking for. If you have been schooled in the theories of conventional technical analysis, you may be blinded by illusions of chart patterns and indicators that have you buying high and selling low. Have no fear, there is a cure. Remove everything from your charts but price and price alone. My hope is that today’s little nugget of information helps you achieve the consistency you’re looking for.
Read the original article here - The Profit Picture
Check now the Forex Foundation Course - Free videos
Note: All information on this page is subject to change. The use of this website constitutes acceptance of our user agreement. Please read our privacy policy and legal disclaimer. Opinions expressed at FXstreet.com are those of the individual authors and do not necessarily represent the opinion of FXstreet.com or its management. Risk Disclosure: Trading foreign exchange on margin carries a high level of risk, and may not be suitable for all investors. The high degree of leverage can work against you as well as for you. Before deciding to invest in foreign exchange you should carefully consider your investment objectives, level of experience, and risk appetite. The possibility exists that you could sustain a loss of some or all of your initial investment and therefore you should not invest money that you cannot afford to lose. You should be aware of all the risks associated with foreign exchange trading, and seek advice from an independent financial advisor if you have any doubts.
Editors’ Picks

EUR/USD holds firm near 1.1850 amid USD weakness
EUR/USD remains strongly bid around 1.1850 in European trading on Monday. The USD/JPY slide-led broad US Dollar weakness helps the pair build on Friday's recovery ahead of the Eurozone Sentix Investor Confidence data for February.

GBP/USD holds medium-term bullish bias above 1.3600
The GBP/USD pair trades on a softer note around 1.3605 during the early European session on Monday. Growing expectation of the Bank of England’s interest-rate cut weighs on the Pound Sterling against the Greenback.

USD/JPY keeps the red below 157.00 on intervention risks
The Japanese Yen sticks to its modest intraday recovery gains against a broadly weaker US Dollar on the back of speculations that authorities will step in to stem weakness in the domestic currency. In fact, Japanese officials stepped up intervention warnings and confirmed close coordination with the US against disorderly FX moves. This, in turn, triggered an intraday USD/JPY turnaround from the 157.65 region, or a two-week top, touched in reaction to Prime Minister Sanae Takaichi's landslide win in Sunday's election.
Editors’ Picks
EUR/USD holds firm near 1.1850 amid USD weakness
EUR/USD remains strongly bid around 1.1850 in European trading on Monday. The USD/JPY slide-led broad US Dollar weakness helps the pair build on Friday's recovery ahead of the Eurozone Sentix Investor Confidence data for February.
USD/JPY keeps the red below 157.00 on intervention risks
The Japanese Yen sticks to its modest intraday recovery gains against a broadly weaker US Dollar on the back of speculations that authorities will step in to stem weakness in the domestic currency. In fact, Japanese officials stepped up intervention warnings and confirmed close coordination with the US against disorderly FX moves. This, in turn, triggered an intraday USD/JPY turnaround from the 157.65 region, or a two-week top, touched in reaction to Prime Minister Sanae Takaichi's landslide win in Sunday's election.

Gold remains supported by China's buying and USD weakness as traders eye US data
Gold struggles to capitalize on its intraday move up and remains below the $5,100 mark heading into the European session amid mixed cues. Data released over the weekend showed that the People's Bank of China extended its buying spree for a 15th month in January. Moreover, dovish US Fed expectations and concerns about the central bank's independence drag the US Dollar lower for the second straight day, providing an additional boost to the non-yielding yellow metal.

Cardano steadies as whale selling caps recovery
Cardano (ADA) steadies at $0.27 at the time of writing on Monday after slipping more than 5% in the previous week. On-chain data indicate a bearish trend, with certain whales offloading ADA. However, the technical outlook suggests bearish momentum is weakening, raising the possibility of a short-term relief rebound if buying interest picks up.

Japanese PM Takaichi nabs unprecedented victory – US data eyed this week
I do not think I would be exaggerating to say that Japanese Prime Minister Sanae Takaichi’s snap general election gamble paid off over the weekend – and then some. This secured the Liberal Democratic Party (LDP) an unprecedented mandate just three months into her tenure.
RECOMMENDED LESSONS
Making money in forex is easy if you know how the bankers trade!
I’m often mystified in my educational forex articles why so many traders struggle to make consistent money out of forex trading. The answer has more to do with what they don’t know than what they do know. After working in investment banks for 20 years many of which were as a Chief trader its second knowledge how to extract cash out of the market.
5 Forex News Events You Need To Know
In the fast moving world of currency markets where huge moves can seemingly come from nowhere, it is extremely important for new traders to learn about the various economic indicators and forex news events and releases that shape the markets. Indeed, quickly getting a handle on which data to look out for, what it means, and how to trade it can see new traders quickly become far more profitable and sets up the road to long term success.
Top 10 Chart Patterns Every Trader Should Know
Chart patterns are one of the most effective trading tools for a trader. They are pure price-action, and form on the basis of underlying buying and selling pressure. Chart patterns have a proven track-record, and traders use them to identify continuation or reversal signals, to open positions and identify price targets.
7 Ways to Avoid Forex Scams
The forex industry is recently seeing more and more scams. Here are 7 ways to avoid losing your money in such scams: Forex scams are becoming frequent. Michael Greenberg reports on luxurious expenses, including a submarine bought from the money taken from forex traders. Here’s another report of a forex fraud. So, how can we avoid falling in such forex scams?
What Are the 10 Fatal Mistakes Traders Make
Trading is exciting. Trading is hard. Trading is extremely hard. Some say that it takes more than 10,000 hours to master. Others believe that trading is the way to quick riches. They might be both wrong. What is important to know that no matter how experienced you are, mistakes will be part of the trading process.
The challenge: Timing the market and trader psychology
Successful trading often comes down to timing – entering and exiting trades at the right moments. Yet timing the market is notoriously difficult, largely because human psychology can derail even the best plans. Two powerful emotions in particular – fear and greed – tend to drive trading decisions off course.