When trading forex, it is vital to engage with the most productive and professional technical tools possible. This will ultimately enhance your prospects and chances of success. Candlestick charting is one such technical tool. Candlestick charts originated in Japan more than a century ago, and have since become one of the most efficient ways to pack information into a single price bar.
Virtually all top forex brokers, like TradeFW.com, display candlestick charts and these are utilized by the majority of traders in the forex markets. A candlestick will display the daily open and close within the wide bodies section, and chart the daily high and low price, through the “shadow” or thin line extending from the top and bottom of the wide-bodied section. Varied colors are introduced to denote rising and falling markets, often red/green or black/white combinations. This is a very concise manner in which to display extensive forex trading data, and it is the collection of these candlesticks which will establish majorly identifiable patterns through which the market direction can be estimated.
Top Candlestick Patterns in Forex Trading
From their inception in 18th Century Japan to being introduced in the western world by Steve Nison in 1991, so many patterns have been identified. Of these patterns, there are several which you will see when trading forex which are important to identify and distinguish.
Engulfing Candlestick Pattern
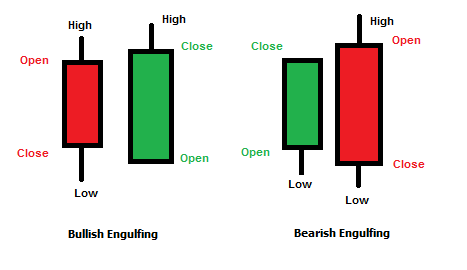
The engulfing candlestick pattern can form in both a bearish and bullish pattern. As displayed, for this to occur, the body of the days candle needs to fully engulf the opposing candle of the previous day. This can be either in a bullish or bearish pattern.
This pattern in trading has strong reversal properties. That means, if the next candle (engulfing candle) is bullish, there is a strong chance for a bullish pattern to develop. Also, if the engulfing candle is bearish, this could signal a reversal in the opposite direction.
A bullish engulfing pattern would indicate to an experienced forex trader, that the current market may have reached its bottom, or alternatively, a bearish engulfing pattern would indicate the peak has been reached.
Hammer Candlestick Pattern
The hammer is a one candlestick pattern which usually indicates a bullish reversal, coming at the end of a downtrend. Although this is identifiable from just one candlestick, there are a number of key characteristics which should be noted.
The hammer should be occurring at the bottom of a downtrend. The lower shadow of the candlestick should be at least double the length of the body, and the upper shadow should ideally be non-existent.
In terms of the candle body, it should indicate that the closing and high positions are similar, or that the open and high positions are similar. Either case shows that the bullish traders were able to combat the negative bear pressure within the market.
Harami Candlestick Pattern
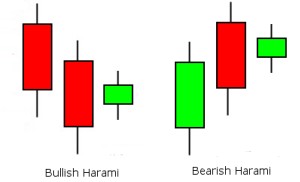
A Harami candlestick pattern can be noted in either bullish or bearish circumstances. Either way, it is a two-candlestick pattern which can be very important to forex trading strategy.
Bearish
A bearish Harami occurs following a large bullish candle before it. On the second candle, the opening price should be lower than the closing price of the previous day, and it does not have the ability to recover back to the previous day’s closing position.
Bullish
Similarly, a bullish Harami pattern will follow a large bearish candle from the previous day. In this case, the second candle will show an opening price higher than the closing price of the previous day. These gaps are essential in Harami formation. This price is then held up, without falling back to the close of the previous day, indicating a bullish pattern.
Piercing Candlestick Pattern
The Piercing candlestick is commonly regarded within forex trading as a bullish reversal pattern. This pattern requires the previous days candle to be largely bearish. The opening price of the candle will also have dropped below the closing price of the previous day to create a gap.
In the Piercing candlestick pattern, this gap will then be filled, with bullish behavior continuing to push the position upwards until the price closes more than half way up the bearish candle of the previous day. This represents a strong recovery of the previous day’s losses and a bullish trend.
Doji Candlestick Pattern
A Doji candlestick pattern is formed when the opening and closing prices of a candle are equal. This demonstrates a level of indecision within the market, since the positions have moved both upward and downward throughout the day, only to settle back at the same position.
The Doji can sometimes be seen at the end of trends and is considered by some forex trader’s and representative of a possible reversal, although this can just as easily be seen as a resting position for a market before it continues its current trend.
Shooting Star Candlestick Pattern
The Shooting Star is a bearish candlestick pattern which can signal the end of an uptrend. This is where they typically occur.
In a Shooting Star pattern, the open, low, and closing price are generally similar. This is combined with a long upper shadow, commonly more than double the length of the candle body. This would indicate that the market tried to push higher throughout the day, but ultimately fell back to near the opening level.
The pattern is considered to be more bearish if the closing position and daily low are the same.
Conclusion
Trading in the forex market especially, can be highly enticing due in part, to the lucrative returns which can potentially be made. Regardless of whether you are a new or experienced trader though, continued education is of vital importance. Learning about charting and the various candlestick charting patterns is a large part of this education.
As regards places to continue your learning and practice of candlestick charting, Tradefw.com provides the ideal learning infrastructure to allow you to practice more and grow you knowledge within one of the best forex brokers, who are completely regulated and highly regarded within the forex trading industry.
CFDs are complex instruments and come with a high risk of losing money rapidly due to leverage. 52% of retail investor accounts lose money when trading CFDs with this provider. You should consider whether you understand how CFDs work and whether you can afford to take the high risk of losing your money. You should make sure that based on your country of residence you are permitted to trade product of the TradeFW.com. Please make sure you are familiar with the company’s risk disclosure.
Editors’ Picks

EUR/USD hits two-day highs near 1.1820
EUR/USD picks up pace and reaches two-day tops around 1.1820 at the end of the week. The pair’s move higher comes on the back of renewed weakness in the US Dollar amid growing talk that the Fed could deliver an interest rate cut as early as March. On the docket, the flash US Consumer Sentiment improves to 57.3 in February.

GBP/USD reclaims 1.3600 and above
GBP/USD reverses two straight days of losses, surpassing the key 1.3600 yardstick on Friday. Cable’s rebound comes as the Greenback slips away from two-week highs in response to some profit-taking mood and speculation of Fed rate cuts. In addition, hawkish comments from the BoE’s Pill are also collaborating with the quid’s improvement.

USD/JPY drops back below 157.00, as focus shifts to Japan snap election
USD/JPY is back in the red below 157.00 in the Asian session on Friday. The Japanese Yen recovers ground against the US Dollar amid some profit-taking ahead of Japan's snap general election on Sunday. The preliminary reading of the Michigan Consumer Sentiment Index report for February will be released later on Friday.
Editors’ Picks

EUR/USD: US Dollar to remain pressured until uncertainty fog dissipates Premium
The EUR/USD pair lost additional ground in the first week of February, settling at around 1.1820. The reversal lost momentum after the pair peaked at 1.2082 in January, its highest since mid-2021.

Gold: Volatility persists in commodity space Premium
After losing more than 8% to end the previous week, Gold (XAU/USD) remained under heavy selling pressure on Monday and dropped toward $4,400. Although XAU/USD staged a decisive rebound afterward, it failed to stabilize above $5,000.

GBP/USD: Pound Sterling tests key support ahead of a big week Premium
The Pound Sterling (GBP) changed course against the US Dollar (USD), with GBP/USD giving up nearly 200 pips in a dramatic correction.

Bitcoin: The worst may be behind us
Bitcoin (BTC) price recovers slightly, trading at $65,000 at the time of writing on Friday, after reaching a low of $60,000 during the early Asian trading session. The Crypto King remained under pressure so far this week, posting three consecutive weeks of losses exceeding 30%.

Three scenarios for Japanese Yen ahead of snap election Premium
The latest polls point to a dominant win for the ruling bloc at the upcoming Japanese snap election. The larger Sanae Takaichi’s mandate, the more investors fear faster implementation of tax cuts and spending plans.
RECOMMENDED LESSONS
Making money in forex is easy if you know how the bankers trade!
I’m often mystified in my educational forex articles why so many traders struggle to make consistent money out of forex trading. The answer has more to do with what they don’t know than what they do know. After working in investment banks for 20 years many of which were as a Chief trader its second knowledge how to extract cash out of the market.
5 Forex News Events You Need To Know
In the fast moving world of currency markets where huge moves can seemingly come from nowhere, it is extremely important for new traders to learn about the various economic indicators and forex news events and releases that shape the markets. Indeed, quickly getting a handle on which data to look out for, what it means, and how to trade it can see new traders quickly become far more profitable and sets up the road to long term success.
Top 10 Chart Patterns Every Trader Should Know
Chart patterns are one of the most effective trading tools for a trader. They are pure price-action, and form on the basis of underlying buying and selling pressure. Chart patterns have a proven track-record, and traders use them to identify continuation or reversal signals, to open positions and identify price targets.
7 Ways to Avoid Forex Scams
The forex industry is recently seeing more and more scams. Here are 7 ways to avoid losing your money in such scams: Forex scams are becoming frequent. Michael Greenberg reports on luxurious expenses, including a submarine bought from the money taken from forex traders. Here’s another report of a forex fraud. So, how can we avoid falling in such forex scams?
What Are the 10 Fatal Mistakes Traders Make
Trading is exciting. Trading is hard. Trading is extremely hard. Some say that it takes more than 10,000 hours to master. Others believe that trading is the way to quick riches. They might be both wrong. What is important to know that no matter how experienced you are, mistakes will be part of the trading process.
The challenge: Timing the market and trader psychology
Successful trading often comes down to timing – entering and exiting trades at the right moments. Yet timing the market is notoriously difficult, largely because human psychology can derail even the best plans. Two powerful emotions in particular – fear and greed – tend to drive trading decisions off course.