![]() Gabe Velázquez
Gabe Velázquez
Online Trading Academy
One asset category that is not very well understood is what we refer to as the credit markets. In the futures market, these encompass all debt instruments such as U.S. Treasury Bills, Notes, and Bonds, and are not limited to derivatives of debt issued by the U.S. treasury. The German debt market can also be traded in the U.S. through most futures brokers on the Eurex exchange. These derivative instruments come with funny names like Schatz, Boble, and Buxl and, finally, the Bund. The different names in all debt instruments are there simply to differentiate the short, medium and long term maturity dates.
These particular European markets are nice to know about, but for those of us in the U.S., they’re not as important as say Greek, Spanish or Italian debt and, of course, the US debt market. Understanding how debt instruments work can gives us important clues not only to the future course of interest rates, but the tone of the U.S. economy, inflation and, by extension, the stock market. The first point about bonds is that their price movement is generally inversely correlated to that of the stock indices. In the chart below, we can clearly see this inverse relationship as the Red line (T-Bond futures) declines while the Blue line representing the S&P E-mini futures rally.
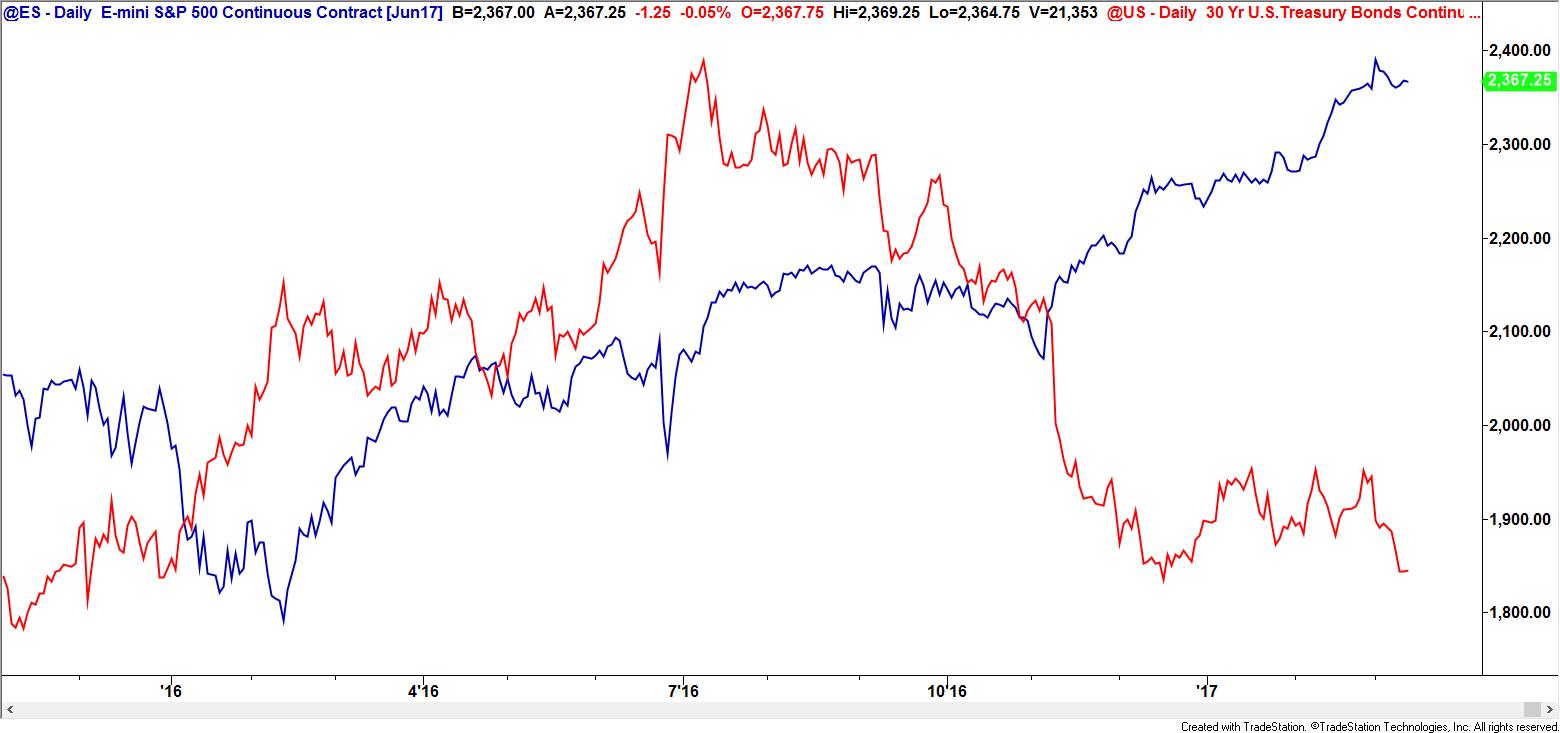
That’s to say that people move money into what they perceive as a safer investment in times of distress, which is what treasuries provide as they are guaranteed by the full faith and credit of the U.S. Treasury. Regardless of the condition of the U.S. Economy, the fact is these are still considered the safest paper on the globe.
When debt is issued by the Treasury, it has a fixed rate attached to it (otherwise known as coupon) and is issued in denominations of $1000. Let’s say the purchaser of the debt obligation buys a 10-year note at par ($1000) with a 6% coupon. Six months later, prices of treasuries move higher because demand increases. He’ll still receive the coupon, $60.00 a year, but the higher price of the bond will lower the yield as a new buyer of the same paper will spend more for the same coupon. In contrast, if the price of that same paper falls in value, the yield would go up as a new purchaser now will spend less to receive the same coupon.
In the futures market, we trade the notional value of the cash Treasury notes and bonds for which the symbols are (TY) for the 10-year note and (US) for the 30-year bond. U.S Treasury debt is broken into 32 parts; hence, futures prices are quoted in 32nds. That being the case, it would make sense that every tick would be 31.25 ($1000/32=31.25). In the TY (T-Notes), however, they’re broken into half again or 64ths, which makes every tick worth $15.625. I know it seems complicated, but it really isn’t once you get used to the contract.
Since bond prices tend to rally when stocks are declining, Bond traders have earned a reputation for being a glum bunch of guys and gals. Conversely, stock traders are usually over-optimistic, and that can also be problematic.
As I mentioned earlier, the bond market can be helpful as an odds enhancer in timing turning points in the stock index futures, as was the case recently and most likely will be again in the future.
The lesson here is that going forward, the stock market will find it hard to move lower if bonds continue their steep decline. The trick is to know when the odds will increase that bonds will stop falling. Are there times when both of these markets trade in tandem? Yes, but normally not for long; usually something gives.
Until next time, I hope everyone has a great week.
This content is intended to provide educational information only. This information should not be construed as individual or customized legal, tax, financial or investment services. As each individual's situation is unique, a qualified professional should be consulted before making legal, tax, financial and investment decisions. The educational information provided in this article does not comprise any course or a part of any course that may be used as an educational credit for any certification purpose and will not prepare any User to be accredited for any licenses in any industry and will not prepare any User to get a job. Reproduced by permission from OTAcademy.com click here for Terms of Use: https://www.otacademy.com/about/terms
Editors’ Picks

EUR/USD hits two-day highs near 1.1820
EUR/USD picks up pace and reaches two-day tops around 1.1820 at the end of the week. The pair’s move higher comes on the back of renewed weakness in the US Dollar amid growing talk that the Fed could deliver an interest rate cut as early as March. On the docket, the flash US Consumer Sentiment improves to 57.3 in February.

GBP/USD reclaims 1.3600 and above
GBP/USD reverses two straight days of losses, surpassing the key 1.3600 yardstick on Friday. Cable’s rebound comes as the Greenback slips away from two-week highs in response to some profit-taking mood and speculation of Fed rate cuts. In addition, hawkish comments from the BoE’s Pill are also collaborating with the quid’s improvement.

USD/JPY drops back below 157.00, as focus shifts to Japan snap election
USD/JPY is back in the red below 157.00 in the Asian session on Friday. The Japanese Yen recovers ground against the US Dollar amid some profit-taking ahead of Japan's snap general election on Sunday. The preliminary reading of the Michigan Consumer Sentiment Index report for February will be released later on Friday.
Editors’ Picks

EUR/USD: US Dollar to remain pressured until uncertainty fog dissipates Premium
The EUR/USD pair lost additional ground in the first week of February, settling at around 1.1820. The reversal lost momentum after the pair peaked at 1.2082 in January, its highest since mid-2021.

Gold: Volatility persists in commodity space Premium
After losing more than 8% to end the previous week, Gold (XAU/USD) remained under heavy selling pressure on Monday and dropped toward $4,400. Although XAU/USD staged a decisive rebound afterward, it failed to stabilize above $5,000.

GBP/USD: Pound Sterling tests key support ahead of a big week Premium
The Pound Sterling (GBP) changed course against the US Dollar (USD), with GBP/USD giving up nearly 200 pips in a dramatic correction.

Bitcoin: The worst may be behind us
Bitcoin (BTC) price recovers slightly, trading at $65,000 at the time of writing on Friday, after reaching a low of $60,000 during the early Asian trading session. The Crypto King remained under pressure so far this week, posting three consecutive weeks of losses exceeding 30%.

Three scenarios for Japanese Yen ahead of snap election Premium
The latest polls point to a dominant win for the ruling bloc at the upcoming Japanese snap election. The larger Sanae Takaichi’s mandate, the more investors fear faster implementation of tax cuts and spending plans.
RECOMMENDED LESSONS
Making money in forex is easy if you know how the bankers trade!
I’m often mystified in my educational forex articles why so many traders struggle to make consistent money out of forex trading. The answer has more to do with what they don’t know than what they do know. After working in investment banks for 20 years many of which were as a Chief trader its second knowledge how to extract cash out of the market.
5 Forex News Events You Need To Know
In the fast moving world of currency markets where huge moves can seemingly come from nowhere, it is extremely important for new traders to learn about the various economic indicators and forex news events and releases that shape the markets. Indeed, quickly getting a handle on which data to look out for, what it means, and how to trade it can see new traders quickly become far more profitable and sets up the road to long term success.
Top 10 Chart Patterns Every Trader Should Know
Chart patterns are one of the most effective trading tools for a trader. They are pure price-action, and form on the basis of underlying buying and selling pressure. Chart patterns have a proven track-record, and traders use them to identify continuation or reversal signals, to open positions and identify price targets.
7 Ways to Avoid Forex Scams
The forex industry is recently seeing more and more scams. Here are 7 ways to avoid losing your money in such scams: Forex scams are becoming frequent. Michael Greenberg reports on luxurious expenses, including a submarine bought from the money taken from forex traders. Here’s another report of a forex fraud. So, how can we avoid falling in such forex scams?
What Are the 10 Fatal Mistakes Traders Make
Trading is exciting. Trading is hard. Trading is extremely hard. Some say that it takes more than 10,000 hours to master. Others believe that trading is the way to quick riches. They might be both wrong. What is important to know that no matter how experienced you are, mistakes will be part of the trading process.
The challenge: Timing the market and trader psychology
Successful trading often comes down to timing – entering and exiting trades at the right moments. Yet timing the market is notoriously difficult, largely because human psychology can derail even the best plans. Two powerful emotions in particular – fear and greed – tend to drive trading decisions off course.