![]() Rick Wright
Rick Wright
Online Trading Academy
Hello traders! This week’s newsletter will show you how to use a smaller economy’s currency to help you decide what to do with a larger economy’s currency.
Just like in the stock and futures markets, there are always things that seem to lead the way of the larger markets. For example, very often a few of the FAANG stocks (Facebook, Apple, Amazon, Netflix, Google/Alphabet) will lead the S&P 500 and Nasdaq higher or lower, or even just watching the Nasdaq in futures will often lead the S&P futures market. In Forex, oftentimes a smaller currency pair will lead the direction of a larger pair.
Now, when I say smaller vs. larger currency pair, what I’m really referring to is the respective size of the economy, or Gross Domestic Product (GDP). Looking at the last full year, according to the International Monetary Fund, the GDP in 2018 for the major forex currency countries was as follows:
| United States | USD | ~ $20 trillion |
| European Union | EUR | ~$18.75 trillion |
| Japan | JPY | ~$4.97 trillion |
| United Kingdom | GBP | ~$2.8 trillion |
| Canada | CAD | ~$1.7 trillion |
| Australia | AUD | ~$1.4 trillion |
| Switzerland | CHF | ~$703 billion |
| New Zealand | NZD | ~$203 billion |
As you can see, New Zealand’s GDP is the smallest of the major currency economies. So, we could use their chart to clue us in on what to do with say, the Australian currency. Since the NZD is smaller and, therefore, probably easier to move around than a larger economy’s currency, theoretically it should move first. Let’s take a look at a couple of charts!
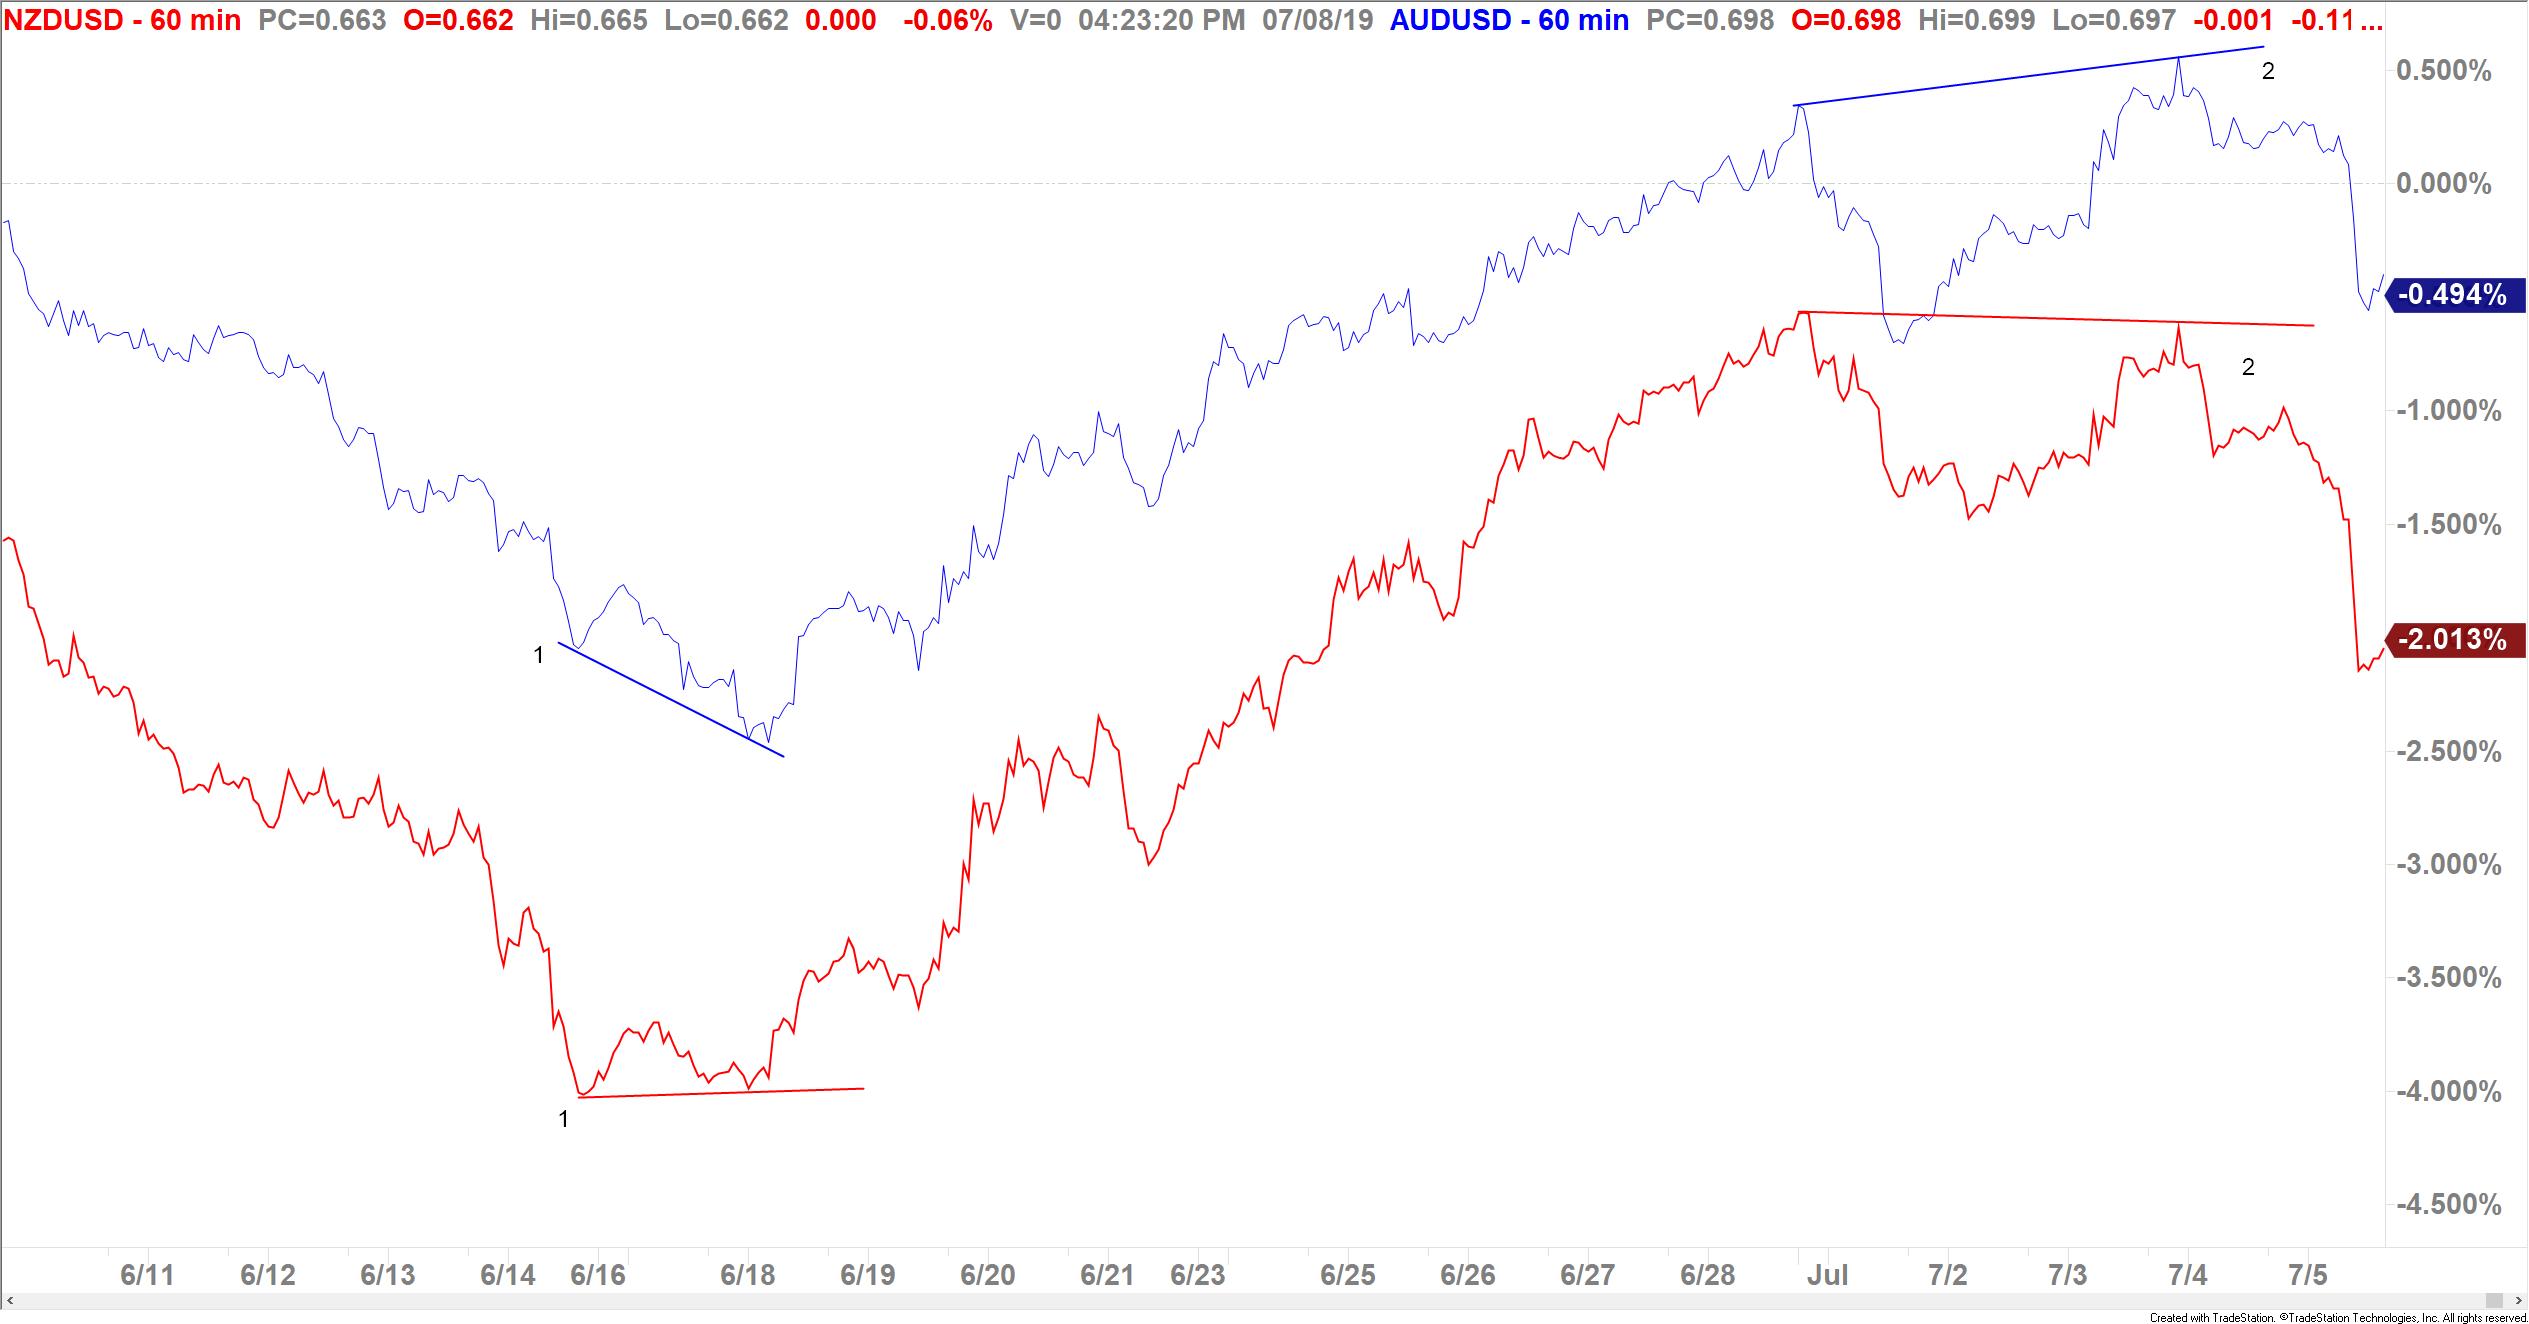
Above is a percent comparison chart on the NZDUSD pair (in red) and the AUDUSD pair (in blue). When looking at the massive difference in the two lines from about June 15-June 18, you can plainly see that the red line marked 1 is pointing up-bullish! At the same lows, the blue line marked 1 is pointing down-still bearish! But since the NZDUSD (red) usually leads the AUDUSD (blue), a trader could have started to look for a long trade in the AUDUSD as the NZDUSD was leading the way! By using this divergence as a clue to buy the AUDUSD, you could have entered your long position at about .6838, from a demand zone that dates all the way back to 2016.
Now, using this same technique, look back at the above chart. Using the red line marked 2, you can see that the NZDUSD has a lower high-bearish!, while the AUDUSD has a higher high at the blue line marked 2-bullish! Again, since the red line often tells us what the blue line will do; if you were still long the AUDUSD (for over 120 pips so far) you could consider exiting that position. If you were looking for a short, the red line gave you a hint that it could work out. As of the time of this writing, that short would be up about 65 pips. These trade opportunities can be seen in the chart below.

A couple of extra tips:
-
Nothing works every time! Always use a stop loss in case the smaller economy doesn’t lead on the next move.
-
I only use this technique with similar currencies/economies. Just like I wouldn’t watch Nvidia (a semiconductor company) to help me trade wheat futures, I stick with the commodity currency economies to help with my decision process-the AUD, NZD, and CAD. The previous charts were only against the USD, yet similar comparisons can be done against other currencies-AUDJPY, NZDJPY, CADJPY, etc.
Read the original article here - Small Economy vs. Big Economy Charts
This content is intended to provide educational information only. This information should not be construed as individual or customized legal, tax, financial or investment services. As each individual's situation is unique, a qualified professional should be consulted before making legal, tax, financial and investment decisions. The educational information provided in this article does not comprise any course or a part of any course that may be used as an educational credit for any certification purpose and will not prepare any User to be accredited for any licenses in any industry and will not prepare any User to get a job. Reproduced by permission from OTAcademy.com click here for Terms of Use: https://www.otacademy.com/about/terms
Editors’ Picks

EUR/USD flirts with daily highs, retargets 1.1900
EUR/USD regains upside traction, returning to the 1.1880 zone and refocusing its attention to the key 1.1900 barrier. The pair’s slight gains comes against the backdrop of a humble decline in the US Dollar as investors continue to assess the latest US CPI readings and the potential Fed’s rate path.

GBP/USD remains well bid around 1.3650
GBP/USD maintains its upside momentum in place, hovering around daily highs near 1.3650 and setting aside part of the recent three-day drop. Cable’s improved sentiment comes on the back of the Greenback’s irresolute price action, while recent hawkish comments from the BoE’s Pill also collaborate with the uptick.

USD/JPY edges up above 153.50 with all eyes on US CPI figures
USD/JPY appreciates above 153.00 but remains on track for a 2.4% weekly loss. Trading volumes remain subdued on Friday, ahead of the IS CPI release. The Yen remains supported by hopes of a stable government and calls for further BoJ tightening.
Editors’ Picks

EUR/USD: Yes, the US economy is resilient – No, that won’t save the US Dollar Premium
Some impressive US data should have resulted in a much stronger USD. Well, it didn’t happen. The EUR/USD pair closed a third consecutive week little changed, a handful of pips above the 1.1800 mark.

Gold: Metals remain vulnerable to broad market mood Premium
Gold (XAU/USD) started the week on a bullish note and climbed above $5,000 before declining sharply and erasing its weekly gains on Thursday, only to recover heading into the weekend.

GBP/USD: Pound Sterling remains below 1.3700 ahead of UK inflation test Premium
The Pound Sterling (GBP) failed to resist at higher levels against the US Dollar (USD), but buyers held their ground amid a US data-busy blockbuster week.

Bitcoin: BTC bears aren’t done yet
Bitcoin (BTC) price slips below $67,000 at the time of writing on Friday, remaining under pressure and extending losses of nearly 5% so far this week.

US Dollar: Big in Japan Premium
The US Dollar (USD) resumed its yearly downtrend this week, slipping back to two-week troughs just to bounce back a tad in the second half of the week.
RECOMMENDED LESSONS
Making money in forex is easy if you know how the bankers trade!
I’m often mystified in my educational forex articles why so many traders struggle to make consistent money out of forex trading. The answer has more to do with what they don’t know than what they do know. After working in investment banks for 20 years many of which were as a Chief trader its second knowledge how to extract cash out of the market.
5 Forex News Events You Need To Know
In the fast moving world of currency markets where huge moves can seemingly come from nowhere, it is extremely important for new traders to learn about the various economic indicators and forex news events and releases that shape the markets. Indeed, quickly getting a handle on which data to look out for, what it means, and how to trade it can see new traders quickly become far more profitable and sets up the road to long term success.
Top 10 Chart Patterns Every Trader Should Know
Chart patterns are one of the most effective trading tools for a trader. They are pure price-action, and form on the basis of underlying buying and selling pressure. Chart patterns have a proven track-record, and traders use them to identify continuation or reversal signals, to open positions and identify price targets.
7 Ways to Avoid Forex Scams
The forex industry is recently seeing more and more scams. Here are 7 ways to avoid losing your money in such scams: Forex scams are becoming frequent. Michael Greenberg reports on luxurious expenses, including a submarine bought from the money taken from forex traders. Here’s another report of a forex fraud. So, how can we avoid falling in such forex scams?
What Are the 10 Fatal Mistakes Traders Make
Trading is exciting. Trading is hard. Trading is extremely hard. Some say that it takes more than 10,000 hours to master. Others believe that trading is the way to quick riches. They might be both wrong. What is important to know that no matter how experienced you are, mistakes will be part of the trading process.
The challenge: Timing the market and trader psychology
Successful trading often comes down to timing – entering and exiting trades at the right moments. Yet timing the market is notoriously difficult, largely because human psychology can derail even the best plans. Two powerful emotions in particular – fear and greed – tend to drive trading decisions off course.