![]() Carley Garner
Carley Garner
DeCarley Trading
Symbols mentioned: ES
Chart Source: QST
Positions: None
Is it time to hedge risk in the S&P 500?
This week has been the perfect storm for a short squeeze in equities. The FOMC decision lands tomorrow, and this morning, we received relatively good news regarding waning inflation; thus, the Fed seems destined for a pause in rate hikes. Further, the June futures and options expire at the end of the week, which is putting pressure on those who have been short and suffering to cover (buy).
That said, the buying has been position-squaring-based, not necessarily fundamental-based, and we are approaching significant technical resistance with the RSI on a daily chart near 70.00. In the short run, the market is vulnerable to a pullback.
If you want to speculate on declining equity prices or hedge your portfolio, a risk reversal seems to make sense. This is the practice of selling a call option (currently overpriced due to the relentless uptrend) and buying a put option (which is underpriced due to the low VIX reading).
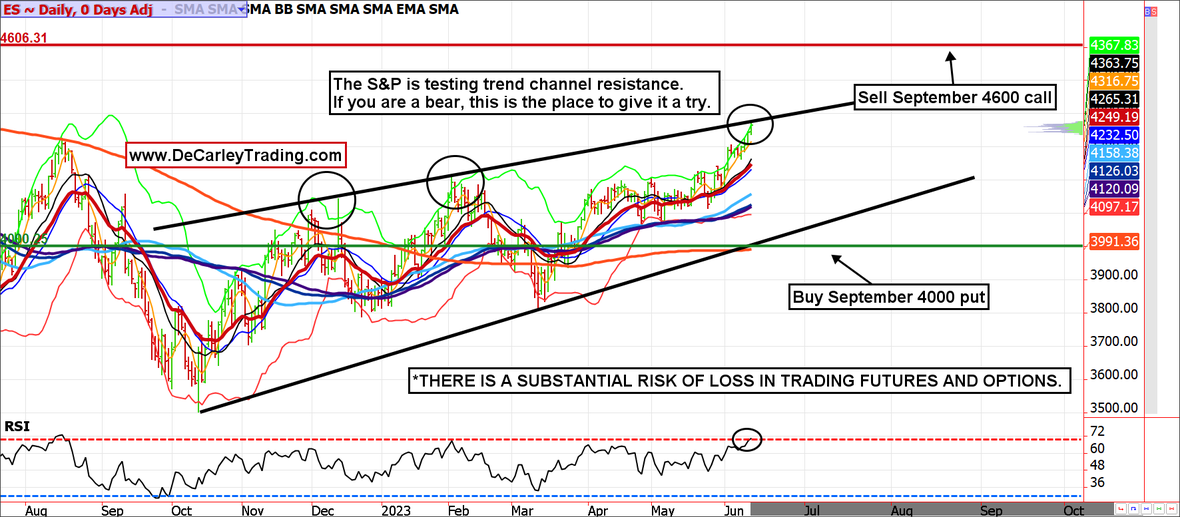
Specifically, we like selling the September S&P 500 4600 call and using the proceeds to buy the 4000 put, the cost of the spread is about $50 plus transaction costs, but risk above 4600 is unlimited for speculators. If this is done as a stock portfolio hedge with an allocation similar to the S&P 500, the risk is an opportunity cost (gains over 4600 are foregone because above that price, the portfolio is gaining, but the hedge is losing, point for point). When done as a hedge, this is a strategy that offers relatively free insurance in exchange for accepting a profit cap above 4600.
A more popular but less efficient portfolio hedging strategy is to buy puts to act as portfolio insurance. This method leaves the upside profit potential open and covers the downside risk beneath the strike price of the put option purchased, but this approach can become quite expensive. For example, purchasing the September 4000 put outright would cost a little over $1,500 for just under three months of protection under 4000. With the September E-mini S&P futures contract at about 4400, the insurance would only pay off if the S&P was 430 lower at expiration (400 points to reach the strike price and another 30 to cover the premium paid); even at that price, it merely breaks even. This means the portfolio still suffered a drawdown in the amount of 400 S&P 500 points plus despite the attempted hedge. If an investor opted to buy similar insurance each quarter, he would be out about $6,000 in premium paid for puts (insurance), or about 2.5% to 3% annually, to protect against sell-offs exceeding about 10%. Most stock market corrections are 10% or less; also, most portfolios wouldn’t fare well if you shaved 3% of the top every year. Yet, a risk reversal strategy (reserved for appropriate timing) removes the cost burden of protecting the downside.
It should be noted that the CME Group offers micro-sized options against the stock indices, allowing for speculation and portfolio hedging in smaller increments. With the S&P 500 at 4400, the E-mini S&P 500s notional value is about $220,000; the micro-sized version is $22,000. Thus, those looking to hedge $22,000 worth of stocks could construct the aforementioned risk reversal strategy using the micro E-mini options.
Due to the volatile nature of the futures markets some information and charts in this report may not be timely. There is substantial risk of loss in trading futures and options. Past performance is not indicative of future results. The information and data in this report were obtained from sources considered reliable. Their accuracy or completeness is not guaranteed and the giving of the same is not to be deemed as an offer or solicitation on our part with respect to the sale or purchase of any securities or commodities. Any decision to purchase or sell as a result of the opinions expressed in this report will be the full responsibility of the person authorizing such transaction.
Editors’ Picks

EUR/USD hovers around nine-day EMA above 1.1800
EUR/USD remains in the positive territory after registering modest gains in the previous session, trading around 1.1820 during the Asian hours on Monday. The 14-day Relative Strength Index momentum indicator at 54 is edging higher, signaling improving momentum. RSI near mid-50s keeps momentum balanced. A sustained push above 60 would firm bullish control.

GBP/USD holds medium-term bullish bias above 1.3600
The GBP/USD pair trades on a softer note around 1.3605 during the early European session on Monday. Growing expectation of the Bank of England’s interest-rate cut weighs on the Pound Sterling against the Greenback.

USD/JPY drops back below 157.00 on Japan's verbal intervention
USD/JPY has come under moderate selling pressure below 157.00 in the Asian session on Monday. The Japanese Yen lost ground to near 157.70 following Japan’s ruling Liberal Democratic Party's outright majority win in Sunday’s lower house election, opening the door to more fiscal stimulus by Prime Minister Sanae Takaichi. However, JPY buyers jumped back and dragged the pair southward on FX verbal intervention by Japan’s Finance Minister Katayama.
Editors’ Picks
EUR/USD hovers around nine-day EMA above 1.1800
EUR/USD remains in the positive territory after registering modest gains in the previous session, trading around 1.1820 during the Asian hours on Monday. The 14-day Relative Strength Index momentum indicator at 54 is edging higher, signaling improving momentum. RSI near mid-50s keeps momentum balanced. A sustained push above 60 would firm bullish control.

Gold sticks to gains above $5,000 as China's buying and Fed rate-cut bets drive demand
Gold surges past the $5,000 psychological mark during the Asian session on Monday in reaction to the weekend data, showing that the People's Bank of China extended its buying spree for a 15th month in January. Moreover, dovish US Federal Reserve expectations and concerns about the central bank's independence drag the US Dollar lower for the second straight day, providing an additional boost to the non-yielding yellow metal.
GBP/USD holds medium-term bullish bias above 1.3600
The GBP/USD pair trades on a softer note around 1.3605 during the early European session on Monday. Growing expectation of the Bank of England’s interest-rate cut weighs on the Pound Sterling against the Greenback.

Bitcoin, Ethereum and Ripple consolidate after massive sell-off
Bitcoin, Ethereum, and Ripple prices consolidated on Monday after correcting by nearly 9%, 8%, and 10% in the previous week, respectively. BTC is hovering around $70,000, while ETH and XRP are facing rejection at key levels.

Weekly column: Saturn-Neptune and the end of the Dollar’s 15-year bull cycle
Tariffs are not only inflationary for a nation but also risk undermining the trust and credibility that go hand in hand with the responsibility of being the leading nation in the free world and controlling the world’s reserve currency.
RECOMMENDED LESSONS
Making money in forex is easy if you know how the bankers trade!
I’m often mystified in my educational forex articles why so many traders struggle to make consistent money out of forex trading. The answer has more to do with what they don’t know than what they do know. After working in investment banks for 20 years many of which were as a Chief trader its second knowledge how to extract cash out of the market.
5 Forex News Events You Need To Know
In the fast moving world of currency markets where huge moves can seemingly come from nowhere, it is extremely important for new traders to learn about the various economic indicators and forex news events and releases that shape the markets. Indeed, quickly getting a handle on which data to look out for, what it means, and how to trade it can see new traders quickly become far more profitable and sets up the road to long term success.
Top 10 Chart Patterns Every Trader Should Know
Chart patterns are one of the most effective trading tools for a trader. They are pure price-action, and form on the basis of underlying buying and selling pressure. Chart patterns have a proven track-record, and traders use them to identify continuation or reversal signals, to open positions and identify price targets.
7 Ways to Avoid Forex Scams
The forex industry is recently seeing more and more scams. Here are 7 ways to avoid losing your money in such scams: Forex scams are becoming frequent. Michael Greenberg reports on luxurious expenses, including a submarine bought from the money taken from forex traders. Here’s another report of a forex fraud. So, how can we avoid falling in such forex scams?
What Are the 10 Fatal Mistakes Traders Make
Trading is exciting. Trading is hard. Trading is extremely hard. Some say that it takes more than 10,000 hours to master. Others believe that trading is the way to quick riches. They might be both wrong. What is important to know that no matter how experienced you are, mistakes will be part of the trading process.
The challenge: Timing the market and trader psychology
Successful trading often comes down to timing – entering and exiting trades at the right moments. Yet timing the market is notoriously difficult, largely because human psychology can derail even the best plans. Two powerful emotions in particular – fear and greed – tend to drive trading decisions off course.