![]() Russ Allen
Russ Allen
Online Trading Academy
In an earlier article, I wrote about the change in an option’s value due to time decay. I mentioned then that there are two additional influences on the price of an option. Today we’ll talk about one of them – the change in price of the underlying stock.
Let’s look at call options. A call option gives its owner the right to buy 100 shares of a specific stock (the underlying stock, or just underlying for short), at a specific price (the strike price), on or before the close of business on a specific future date (the expiration date). Let’s jump right in with a concrete example. On February 19, the stock of IBM closed at $138.19 per share. On that day, there were call options to buy IBM shares at $135 per share, expiring in 120 days on June 21, 2019. The price of the call option was $7.90 per share, or $790 per 100-share option contract.
Anyone who bought that call option was expecting IBM stock to go up in price. Since the option owner had the right to buy IBM at the fixed price of $135, the higher IBM went above $135, the more they could make, with no limit. It would not even be necessary to exercise the option to make a profit if IBM went up; the owner of an option could plan simply to sell the option itself at a higher price.
For example, say that by the expiration date, IBM went up to $150. That is $15 higher than the call strike price of $135. So, the option at that point would have $15 per share of intrinsic value. If it was in fact the expiration date, with no time remaining in the option’s life, then there would be no extrinsic value, also called time value; so, in that case, that $15 of intrinsic value would be the option’s total value. The option owner could sell the option at that time for $15 per share ($1,500 per contract), making a nice profit of $710 on the $790 per contract original investment.
Notice that in this example, the stock price would have gone up from $138.19 to $150, an increase of $11.81 or 8.5%. The option, meanwhile, would have gone from $7.90 to $15.00, an increase of $7.10 or 89%. That’s the power of leverage in option trading – an 8.5% change in the stock led to an 89% gain on the option.
What about that increase in the option price? It was not a one-to-one match with the stock price. Is there a way to estimate how much an option’s price will change when the stock price changes? This would seem to be necessary to calculate potential profit or loss.
In fact, there is. At any moment in time, the ratio of option price change to stock price change can be calculated. It is called the Delta of the option and is readily available. It is normally displayed in the list of options (the option chain). Below is the partial option chain for those IBM June options:
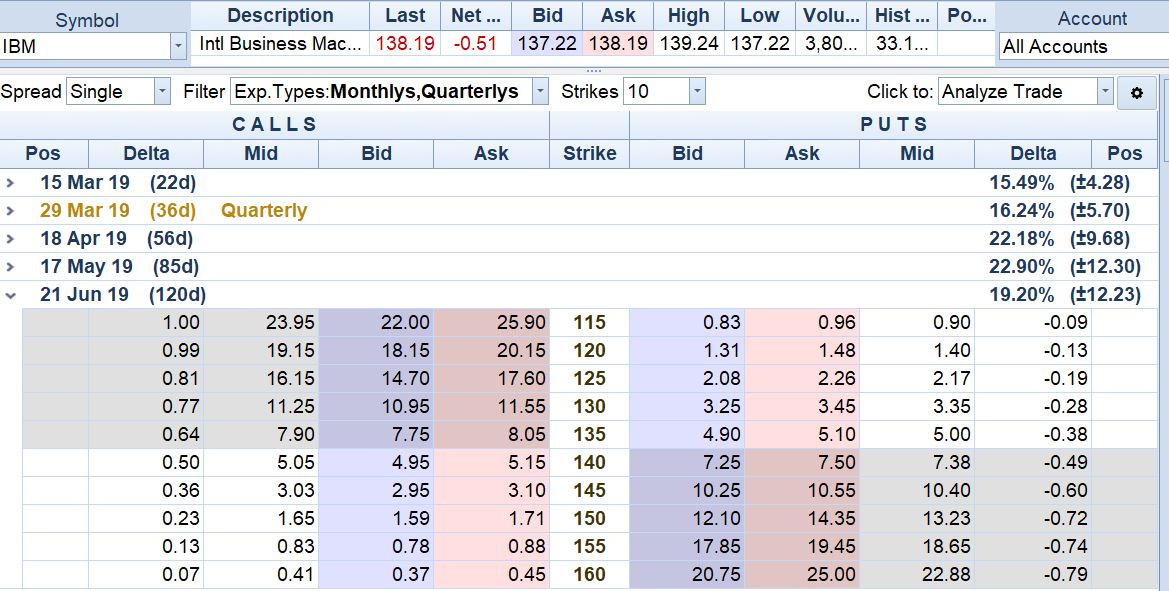
Note the number in the Delta column for the 135 call above. The Delta reading of .64 meant that for the first one dollar that IBM’s stock price went up, the call’s value would go up by .64 cents per share.
Also notice that the options at other strike prices have different Delta values. This shows that Delta is not static. After that next $1.00 move in the stock, the Delta of an option will be different. In fact, as the stock continues to move, for each additional dollar it climbs, the value of the call option will increase by a larger and larger amount. If the stock climbs high enough above the option’s strike price, the option’s delta will reach its maximum value, which is 100%, or 1.0. If the stock continues to go up even farther, then from that point on the option’s price will finally change in a one-to-one ratio with the stock. In that case we say that the option is at parity. In the above chain, the call at the 115 strike is at parity.
Whew! It appears that calculating an option’s price change due to stock movement is not so straightforward, with the Delta constantly changing. But there is help for that. Modern option trading software has a feature called the option profit and loss graph, which can tell us what an option’s price would be given any stock price. The software also knows the current option price, so it can calculate for us what our profit or loss would be given any particular stock price. The profit/loss graph allows us to estimate our profit should the stock hit a target price.
In the graph below, the blue line shows what the profit or loss on this option would be at different stock prices, given the original purchase price of $790 for the contract. The stock price is on the bottom axis; profit/loss is on the left axis. We’ve put in a marker, the gold vertical line, at our target price of $150.
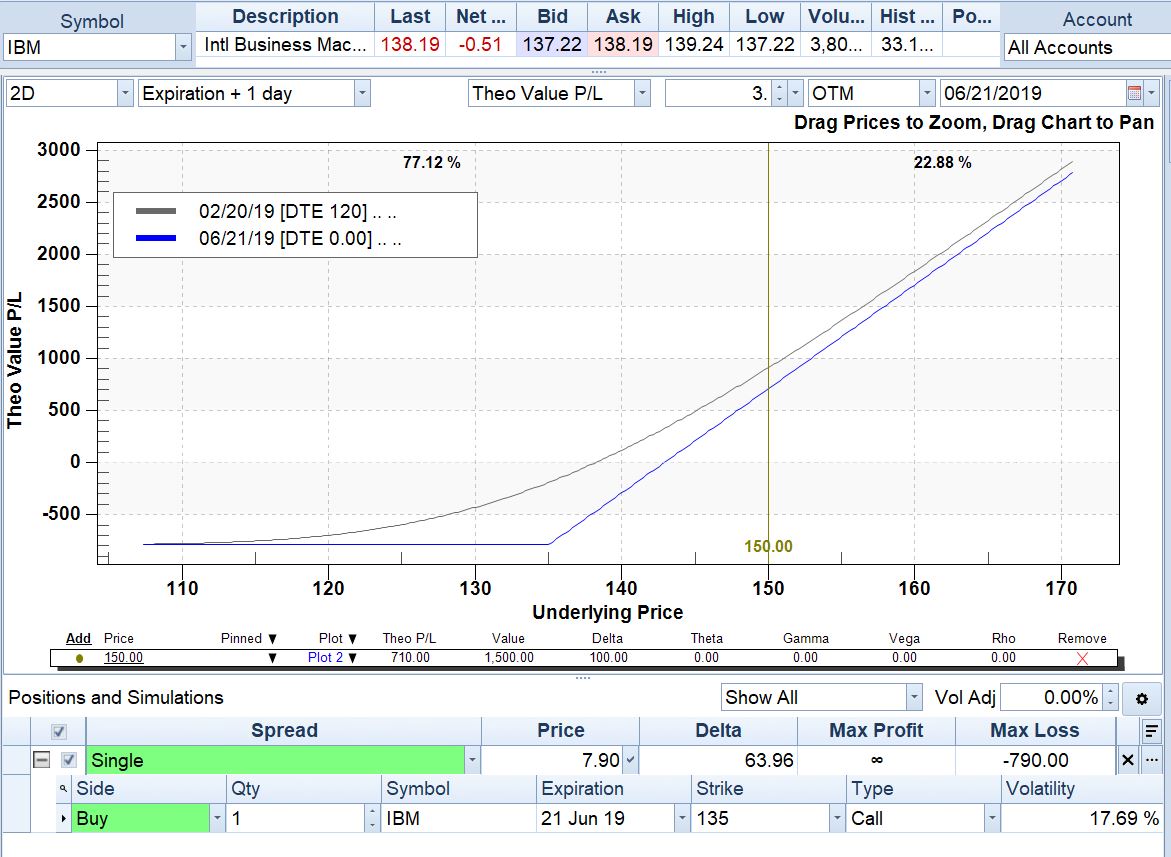
We can see in the boxed table below the graph that at a stock price of $150, the Value of the option would be $1,500, and the theoretical profit or loss (Theo P/L) would be $710.00. We could put in other markers at any stock price we wanted. For example, to calculate how much we would lose if IBM should drop to some predetermined stop-loss price.
To wrap this up, we know that option prices change when the underlying stock price changes. We now know that we can estimate just how much an option’s price will change when the stock reaches any desired target price or stop-loss price. This is the information that we need to calculate reward and risk on our trades. The option P/L graph is our most important tool.
We’ve now looked at the effect on option prices of two of the three forces that move options – time decay and underlying stock price change. Next time, we’ll see how the option graph can tell us the effect of the final one of the three forces.
Until next time, good trading!
Read the original article here - Option Prices and Stock Prices
This content is intended to provide educational information only. This information should not be construed as individual or customized legal, tax, financial or investment services. As each individual's situation is unique, a qualified professional should be consulted before making legal, tax, financial and investment decisions. The educational information provided in this article does not comprise any course or a part of any course that may be used as an educational credit for any certification purpose and will not prepare any User to be accredited for any licenses in any industry and will not prepare any User to get a job. Reproduced by permission from OTAcademy.com click here for Terms of Use: https://www.otacademy.com/about/terms
Editors’ Picks

EUR/USD climbs to two-week highs beyond 1.1900
EUR/USD is keeping its foot on the gas at the start of the week, reclaiming the 1.1900 barrier and above on Monday. The US Dollar remains on the back foot, with traders reluctant to step in ahead of Wednesday’s key January jobs report, allowing the pair to extend its upward grind for now.

GBP/USD hits three-day peaks, targets 1.3700
GBP/USD is clocking decent gains at the start of the week, advancing to three-day highs near 1.3670 and building on Friday’s solid performance. The better tone in the British Pound comes on the back of the intense sekk-off in the Greenback and despite re-emerging signs of a fresh government crisis in the UK.

USD/JPY recedes to multi-day lows near 155.50
USD/JPY is pulling back sharply at the start of the week, slipping back toward the 155.50 area as speculation mounts that authorities could step in to rein in further Yen weakness. That narrative gained traction after PM S. Takaichi secured a landslide victory in Sunday’s election, stoking expectations of a tougher line in defence of the domestic currency.
Editors’ Picks
EUR/USD climbs to two-week highs beyond 1.1900
EUR/USD is keeping its foot on the gas at the start of the week, reclaiming the 1.1900 barrier and above on Monday. The US Dollar remains on the back foot, with traders reluctant to step in ahead of Wednesday’s key January jobs report, allowing the pair to extend its upward grind for now.
USD/JPY recedes to multi-day lows near 155.50
USD/JPY is pulling back sharply at the start of the week, slipping back toward the 155.50 area as speculation mounts that authorities could step in to rein in further Yen weakness. That narrative gained traction after PM S. Takaichi secured a landslide victory in Sunday’s election, stoking expectations of a tougher line in defence of the domestic currency.

Gold treads water around $5,000
Gold is trading in an inconclusive fashion around the key $5,000 mark on Monday week. Support is coming from fresh signs of further buying from the PBoC, while expectations that the Fed could turn more dovish, alongside concerns over its independence, keep the demand for the precious metal running.

Crypto Today: Bitcoin steadies around $70,000, Ethereum and XRP remain under pressure
Bitcoin hovers around $70,000, up near 15% from last week's low of $60,000 despite low retail demand. Ethereum delicately holds $2,000 support as weak technicals weigh amid declining futures Open Interest. XRP seeks support above $1.40 after facing rejection at $1.54 during the previous week's sharp rebound.

Japanese PM Takaichi nabs unprecedented victory – US data eyed this week
I do not think I would be exaggerating to say that Japanese Prime Minister Sanae Takaichi’s snap general election gamble paid off over the weekend – and then some. This secured the Liberal Democratic Party (LDP) an unprecedented mandate just three months into her tenure.
RECOMMENDED LESSONS
Making money in forex is easy if you know how the bankers trade!
I’m often mystified in my educational forex articles why so many traders struggle to make consistent money out of forex trading. The answer has more to do with what they don’t know than what they do know. After working in investment banks for 20 years many of which were as a Chief trader its second knowledge how to extract cash out of the market.
5 Forex News Events You Need To Know
In the fast moving world of currency markets where huge moves can seemingly come from nowhere, it is extremely important for new traders to learn about the various economic indicators and forex news events and releases that shape the markets. Indeed, quickly getting a handle on which data to look out for, what it means, and how to trade it can see new traders quickly become far more profitable and sets up the road to long term success.
Top 10 Chart Patterns Every Trader Should Know
Chart patterns are one of the most effective trading tools for a trader. They are pure price-action, and form on the basis of underlying buying and selling pressure. Chart patterns have a proven track-record, and traders use them to identify continuation or reversal signals, to open positions and identify price targets.
7 Ways to Avoid Forex Scams
The forex industry is recently seeing more and more scams. Here are 7 ways to avoid losing your money in such scams: Forex scams are becoming frequent. Michael Greenberg reports on luxurious expenses, including a submarine bought from the money taken from forex traders. Here’s another report of a forex fraud. So, how can we avoid falling in such forex scams?
What Are the 10 Fatal Mistakes Traders Make
Trading is exciting. Trading is hard. Trading is extremely hard. Some say that it takes more than 10,000 hours to master. Others believe that trading is the way to quick riches. They might be both wrong. What is important to know that no matter how experienced you are, mistakes will be part of the trading process.
The challenge: Timing the market and trader psychology
Successful trading often comes down to timing – entering and exiting trades at the right moments. Yet timing the market is notoriously difficult, largely because human psychology can derail even the best plans. Two powerful emotions in particular – fear and greed – tend to drive trading decisions off course.