Surfing is very popular where I live in Southern California. It is a sport that I took up while living on the beach. Analyzing and trading in the markets is very similar to that sport. In fact, many technical analysts have compared the market fluctuations to the waves of the ocean. Just like a surfer, it is easier to travel in the direction of the waves than to paddle against it.
The waves of the market are the trends. It is crucial for a trader to identify the trend that they can surf to profits. If you keep trying to paddle against the waves, you can make some progress but it is much easier to ride the waves to larger profits.
There are several ways to identify the trend you are trading or investing in. W.D. Gann was a trader in the early 1900’s who believed that price could be predicted by the use of three basic premises:
-
The only three factors you need to consider are: price, time and range
-
The markets are geometric in design; patterns can be identified
-
The markets are cyclical in nature, there are regularly repeating highs and lows.
He applied angled lines to charts called Gann Fans to identify potential support and resistance levels as we move in trend from those areas. This is not necessarily going to replace the supply and demand levels that you are already familiar with on your charts, but they can add to your precision when choosing entry and exit points for trades and identify major changes in trend in larger timeframes.
Gann believed that price moved in certain repeatable patterns, based on price and time; you can use the angles of the fan to see areas where prices are likely to turn due to a combination of the two. Since there are cycles that can be seen in all securities, a trend that is approaching the end of that cycle should turn at a predictable point. That point is the intersection of a fan.
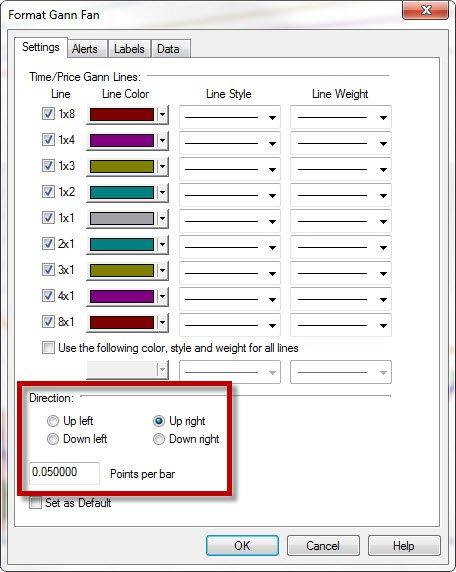
Most trading software will have Gann Fans available. You will see TradeStation’s version in the following examples. You will have to enter the “Points per Bar” that will set the angle of the fan and also the direction of the fan.
There are no set numbers that “should” be used, but as a general guide you can try the following settings for the points per bar.
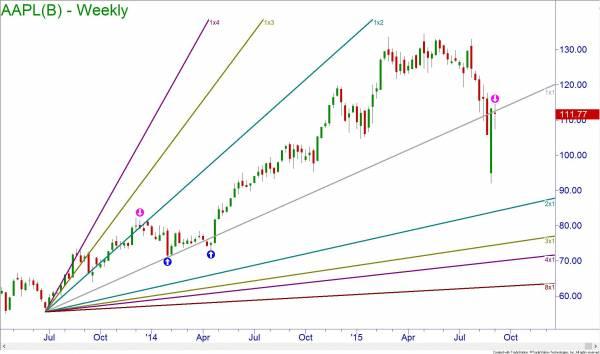
Here is an example of the Gann Fans being applied to a weekly chart of AAPL. The Gann Fans helped identify the trend off the 2013 lows and acted as support in 2014. Currently, price is using the 1×1 line as a bit of resistance.
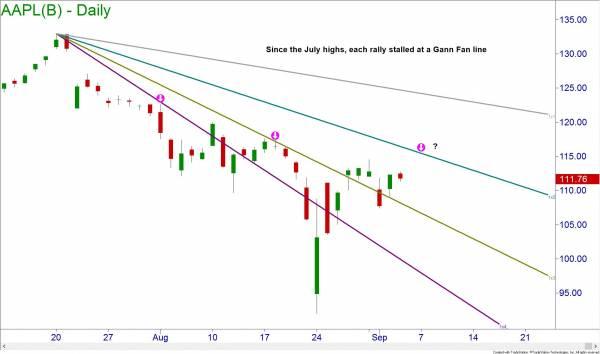
Moving into the daily chart of the stock, the Gann Fan from the July highs has identified the bullish stalling point and beginning of price drops. There could be another coming at about $115.
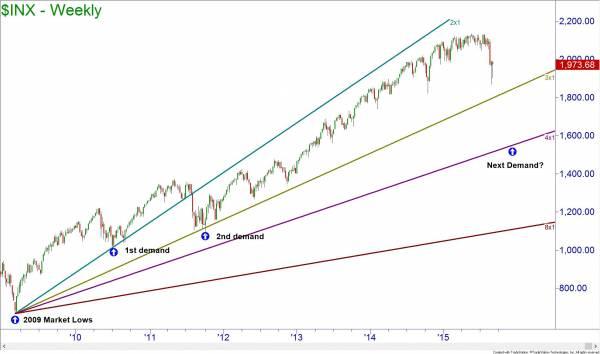
When applied to the equity market indexes, the Gann Fans reveal some amazing information about the trends. The weekly S&P 500 Index chart shows that during the current bull market, every time that price corrected it sought out the next fan line extended from the 2009 market low. This would suggest that the next bounce isn’t due until the index reaches 1600.
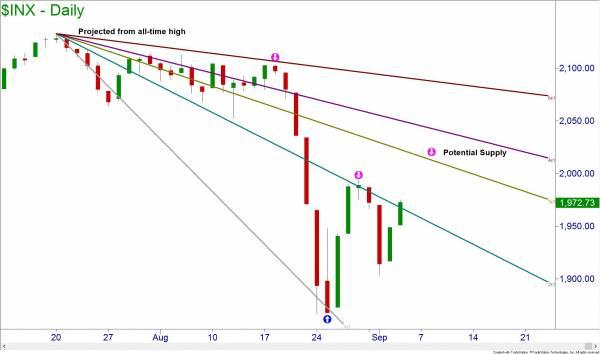
Looking at the daily chart of the index and applying the fan to the all-time market high shows that the index has been respecting the lines for both support and resistance and may offer price targets for the current move upward.
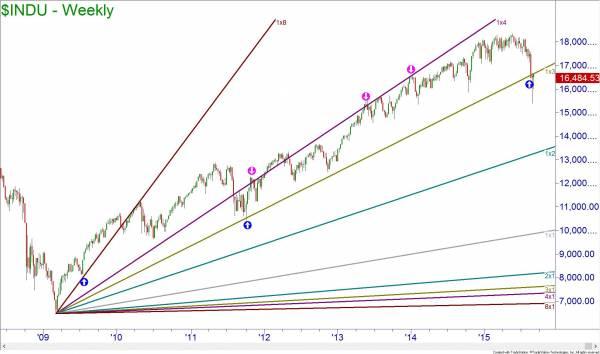
The Gann Fan applied to the Dow weekly chart is even more dramatic. The bullish trend was strong in 2009 but faded in 2011 to settle between the 1×4 and 1×3 lines. The recent breakdown in price could mean that the 1×3 may act as resistance and the 1×2 line is a potential target for the bears.
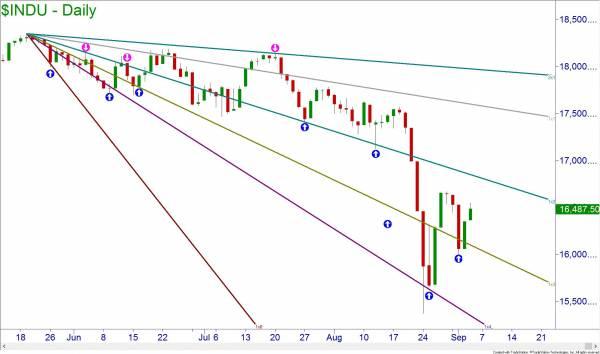
The daily chart also shows interesting patterns.
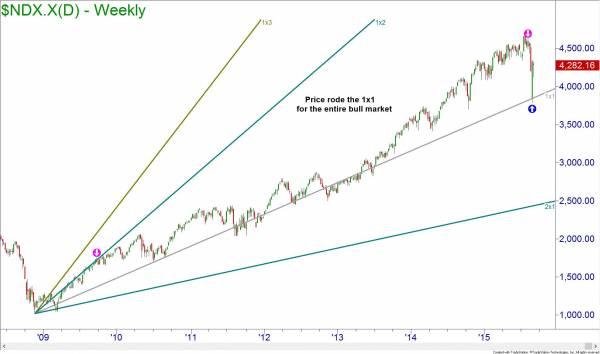
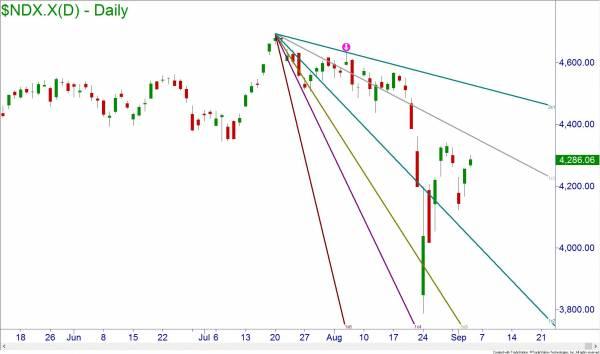
When the strong bullish trend began in the Nasdaq, the 1×2 fan line marked the top of the trend. Eventually as the trend matured and weakened, the index settled on the 1×1 fan line. This was also the support for the August drop in price.
It is not surprising that price returns to the fan lines when it becomes overextended. If the 1×1 should fail to hold though, there is a lot of room to the next line.
The fans were not as reliable when applied to the daily chart of the Nasdaq. The 2×1 did hold prices down and the 1×1 should be watched as potential resistance.
Price, time and patterns are essential to catching the wave to surf your way to trading and investing profits. Come visit your local Online Trading Academy center today to learn more about how to trade like a professional. Until next time, hang ten and put your toes on the nose.
Neither Freedom Management Partners nor any of its personnel are registered broker-dealers or investment advisers. I will mention that I consider certain securities or positions to be good candidates for the types of strategies we are discussing or illustrating. Because I consider the securities or positions appropriate to the discussion or for illustration purposes does not mean that I am telling you to trade the strategies or securities. Keep in mind that we are not providing you with recommendations or personalized advice about your trading activities. The information we are providing is not tailored to any individual. Any mention of a particular security is not a recommendation to buy, sell, or hold that or any other security or a suggestion that it is suitable for any specific person. Keep in mind that all trading involves a risk of loss, and this will always be the situation, regardless of whether we are discussing strategies that are intended to limit risk. Also, Freedom Management Partners’ personnel are not subject to trading restrictions. I and others at Freedom Management Partners could have a position in a security or initiate a position in a security at any time.
Editors’ Picks

EUR/USD: US Dollar to remain pressured until uncertainty fog dissipates Premium
The EUR/USD pair lost additional ground in the first week of February, settling at around 1.1820. The reversal lost momentum after the pair peaked at 1.2082 in January, its highest since mid-2021.

Gold: Volatility persists in commodity space Premium
After losing more than 8% to end the previous week, Gold (XAU/USD) remained under heavy selling pressure on Monday and dropped toward $4,400. Although XAU/USD staged a decisive rebound afterward, it failed to stabilize above $5,000.

GBP/USD: Pound Sterling tests key support ahead of a big week Premium
The Pound Sterling (GBP) changed course against the US Dollar (USD), with GBP/USD giving up nearly 200 pips in a dramatic correction.

Bitcoin: The worst may be behind us
Bitcoin (BTC) price recovers slightly, trading at $65,000 at the time of writing on Friday, after reaching a low of $60,000 during the early Asian trading session. The Crypto King remained under pressure so far this week, posting three consecutive weeks of losses exceeding 30%.

Three scenarios for Japanese Yen ahead of snap election Premium
The latest polls point to a dominant win for the ruling bloc at the upcoming Japanese snap election. The larger Sanae Takaichi’s mandate, the more investors fear faster implementation of tax cuts and spending plans.
RECOMMENDED LESSONS
Making money in forex is easy if you know how the bankers trade!
I’m often mystified in my educational forex articles why so many traders struggle to make consistent money out of forex trading. The answer has more to do with what they don’t know than what they do know. After working in investment banks for 20 years many of which were as a Chief trader its second knowledge how to extract cash out of the market.
5 Forex News Events You Need To Know
In the fast moving world of currency markets where huge moves can seemingly come from nowhere, it is extremely important for new traders to learn about the various economic indicators and forex news events and releases that shape the markets. Indeed, quickly getting a handle on which data to look out for, what it means, and how to trade it can see new traders quickly become far more profitable and sets up the road to long term success.
Top 10 Chart Patterns Every Trader Should Know
Chart patterns are one of the most effective trading tools for a trader. They are pure price-action, and form on the basis of underlying buying and selling pressure. Chart patterns have a proven track-record, and traders use them to identify continuation or reversal signals, to open positions and identify price targets.
7 Ways to Avoid Forex Scams
The forex industry is recently seeing more and more scams. Here are 7 ways to avoid losing your money in such scams: Forex scams are becoming frequent. Michael Greenberg reports on luxurious expenses, including a submarine bought from the money taken from forex traders. Here’s another report of a forex fraud. So, how can we avoid falling in such forex scams?
What Are the 10 Fatal Mistakes Traders Make
Trading is exciting. Trading is hard. Trading is extremely hard. Some say that it takes more than 10,000 hours to master. Others believe that trading is the way to quick riches. They might be both wrong. What is important to know that no matter how experienced you are, mistakes will be part of the trading process.
The challenge: Timing the market and trader psychology
Successful trading often comes down to timing – entering and exiting trades at the right moments. Yet timing the market is notoriously difficult, largely because human psychology can derail even the best plans. Two powerful emotions in particular – fear and greed – tend to drive trading decisions off course.

