In today’s difficult and especially unpredictable trading environment, one of the best tools to help you find exit and entry signals might incorporate a practical Fibonacci retracement strategy in conjunction with other widely used technical indicators such as support and resistance levels, MACD and momentum indicators such as RSI.
Fibonacci retracement works well using MACD because the parameters of market swings can be pre-set with the moment indicator (MACD) confirming a reversal in the trend.
Take for example the USD/JPY chart below:
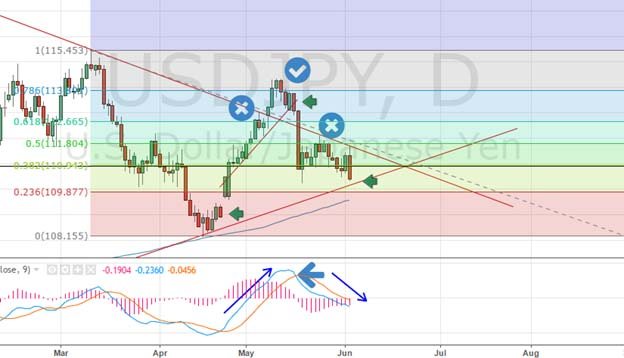
Around mid-April the price bottoms out and bounces up from the long-term upwards trending support line. The price stabilises and the MACD indicator produces an upward cross. The combination of these important signals might convince a trader to jump in long at the first green arrow.
As the price moves up with momentum, it becomes clear that the limits of the short-term range are in place and Fibonacci lines can be drawn over the chart.
The first challenge to the upwards price momentum occurs at the first blue cross set at the 0.618 Fibonacci level. A trader might plausibly argue that the move has run its course and can go no further than the long term downwards trending resistance line. However, the MACD indicator says otherwise and signals the US dollar still has legs. In this case, indicators working hand in hand, we can see that a correct exit sign has yet to be produced and a wiser trader would hold the position.
The price then breaks out up past resistance and hits the 0.718 Fibonacci level where it stalls. This is the level before the currency fully retraces and presents a formidable trial. At this point momentum and MACD starts to stabilise. The price falls slides below a minor support line and the MACD throws up a downwards cross.
CombiningFibonacci, MACD and resistance/support we obtain a solid exit point, which is also ashort entry signal indicated by the second green arrow. The wise trader then swaps the buy position for a sell.
Finally, as the price heavily drops back into the long-term triangulating range it immediately bounces up to hit the long term downwards trending resistance line indicated by the second blue cross and the 0.50 Fibonacci level. The calm trader would hold the short position as the MACD indicator foretells further selling pressure. After a couple of days, the price continues its journey south towards the upwards support line which is another exit (and potentially entry) signal indicated by the third green arrow. If the MACD crosses over at this point, it would then confirm the swing.
The Fibonacci Retracements at 23.6%, 38.2%, 50% and 61.8% stem from ratios found within the Fibonacci sequence. The 50% retracement is not based on a Fibonacci number. Instead, this number stems from Dow Theory's assertion that the Averages often retrace half their prior move and represents an important level.
Fibonacci works well with momentum indicators such as the relative strength index (RSI) because it helps to identify levels at which the price might turn up or down from overbought or oversold regions.
Take for example the daily USD/CHF chart below:
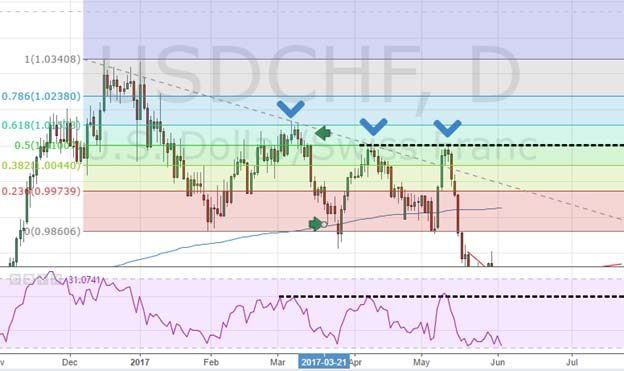
In this chart, we can see that the price rose to the 0.618 Fibonacci level, hitting at the same time an overbought point indicated by the RSI signal line touching 0.60. The price stalls at this level and starts to double back producing a sell signal.
The position is closed at the point at which RSI goes to oversold coinciding with the price dropping to the formidable 200 day moving average. It should be noted that following this trade, the price can be perceived as range bound with strength limited by the 0.50 Fibonacci level and weakness supported at the 0% Fibonacci level.
In summary, we can see that Fibonacci percentages are best used in combination with other technical indicators. In fact, most analysts would say that it is quite ineffective by itself. Fibonacci levels should never be seen as exact points to enter or exit positions and therefore other technical indicators must provide important context. Fibonacci levels on a chart should be viewed as approximate areas at which the market considers its next move and not as a clear cut mathematical marker.
All essays, research and information found above represent the analysis and opinion of Leverate only. As such it may prove wrong and be a subject to change without notice. Opinions and analysis were based on data available to the author of the respective essays at the time of writing. Although the information provided above is based on careful research and sources that are believed to be accurate, Leverate does not guarantee the accuracy or thoroughness of the data or information reported. The opinions published above are neither an offer nor a recommendation to purchase or sell any securities. Leverate is not a Registered Securities Advisor. By reading Leverate’s reports you fully agree that they will not be held responsible or liable for any decisions you make regarding any information provided in these reports. Investment trading and speculation in any financial markets may involve risk of loss.e risk of loss.
Editors’ Picks

EUR/USD stays defensive below 1.1750 as USD finds its feet
EUR/USD kicks off the new week on a softer note, holding below 1.1750 in European trading on Monday. The pair faces challenges due to a pause in the US Dollar downtrend, with traders shifting their focus to the delayed US Nonfarm Payrolls and CPI data for fresh directives. The ECB policy decision is also eagerly awaited.

GBP/USD holds steady above 1.3350 as traders await key data and BoE
GBP/USD remains on the back foot above 1.3350 in the European session on Monday, though it lacks bearish conviction and holds above the key 200-day SMA support. The US Dollar holds its recovery mode ahead of key data releases, while the Pound Sterling faces headwinds from the expected BoE rate cut this week.

Japanese Yen adds to strong gains and drags USD/JPY to 155.00 amid hawkish BoJ bets
The Japanese Yen extends its steady intraday ascent through the Asian session on Monday, dragging the USD/JPY pair to the 155.00 psychological mark in the last hour. Against the backdrop of the recent shift in rhetoric from Bank of Japan Governor Kazuo Ueda, an improvement in business confidence reaffirms market bets for an imminent rate hike this week.
Editors’ Picks
EUR/USD stays defensive below 1.1750 as USD finds its feet
EUR/USD kicks off the new week on a softer note, holding below 1.1750 in European trading on Monday. The pair faces challenges due to a pause in the US Dollar downtrend, with traders shifting their focus to the delayed US Nonfarm Payrolls and CPI data for fresh directives. The ECB policy decision is also eagerly awaited.
GBP/USD holds steady above 1.3350 as traders await key data and BoE
GBP/USD remains on the back foot above 1.3350 in the European session on Monday, though it lacks bearish conviction and holds above the key 200-day SMA support. The US Dollar holds its recovery mode ahead of key data releases, while the Pound Sterling faces headwinds from the expected BoE rate cut this week.

Gold climbs to seven-week highs on Fed rate cut bets, safe-haven demand
Gold price rises to seven-week highs to near $4,350 during the early European trading hours on Monday. The precious metal extends its upside amid the prospect of interest rate cuts by the US Fed next year. Lower interest rates could reduce the opportunity cost of holding Gold, supporting the non-yielding precious metal.

Solana consolidates as spot ETF inflows near $1 billion signal institutional dip-buying
Solana price hovers above $131 at the time of writing on Monday, nearing the upper boundary of a falling wedge pattern, awaiting a decisive breakout. On the institutional side, demand for spot Solana Exchange-Traded Funds remained firm, pushing total assets under management to nearly $1 billion since launch.

Big week ends with big doubts
The S&P 500 continued to push higher yesterday as the US 2-year yield wavered around the 3.50% mark following a Federal Reserve (Fed) rate cut earlier this week that was ultimately perceived as not that hawkish after all. The cut is especially boosting the non-tech pockets of the market.
RECOMMENDED LESSONS
Making money in forex is easy if you know how the bankers trade!
I’m often mystified in my educational forex articles why so many traders struggle to make consistent money out of forex trading. The answer has more to do with what they don’t know than what they do know. After working in investment banks for 20 years many of which were as a Chief trader its second knowledge how to extract cash out of the market.
5 Forex News Events You Need To Know
In the fast moving world of currency markets where huge moves can seemingly come from nowhere, it is extremely important for new traders to learn about the various economic indicators and forex news events and releases that shape the markets. Indeed, quickly getting a handle on which data to look out for, what it means, and how to trade it can see new traders quickly become far more profitable and sets up the road to long term success.
Top 10 Chart Patterns Every Trader Should Know
Chart patterns are one of the most effective trading tools for a trader. They are pure price-action, and form on the basis of underlying buying and selling pressure. Chart patterns have a proven track-record, and traders use them to identify continuation or reversal signals, to open positions and identify price targets.
7 Ways to Avoid Forex Scams
The forex industry is recently seeing more and more scams. Here are 7 ways to avoid losing your money in such scams: Forex scams are becoming frequent. Michael Greenberg reports on luxurious expenses, including a submarine bought from the money taken from forex traders. Here’s another report of a forex fraud. So, how can we avoid falling in such forex scams?
What Are the 10 Fatal Mistakes Traders Make
Trading is exciting. Trading is hard. Trading is extremely hard. Some say that it takes more than 10,000 hours to master. Others believe that trading is the way to quick riches. They might be both wrong. What is important to know that no matter how experienced you are, mistakes will be part of the trading process.
The challenge: Timing the market and trader psychology
Successful trading often comes down to timing – entering and exiting trades at the right moments. Yet timing the market is notoriously difficult, largely because human psychology can derail even the best plans. Two powerful emotions in particular – fear and greed – tend to drive trading decisions off course.