Indicators are an excellent way of enhancing your trading strategy. To remind you, in our series of educational articles posted under the SimpleFX CFD Academy we understand trading strategy as a set of heuristics for efficient entries and exits.
First of all, no indicator works well for every trader, every asset and every timeframe. Most of them don't work. You need to practice a lot to find the right mix that works for you.
In this post, I will explain what RSI is and how it can be used as a confirmation indicator.
Is it oversold or overbought?
The Relative Strength Index is 40 years old as it was first introduced by American mechanical engineer and real estate developer J. Welles Wilder Jr. in 1978.
It’s quite straightforward. The indicator oscillates between 0 and 100. When it goes above 70, it means that an asset is overbought and when it goes below 30 - it’s supposed to be a sign its oversold.
RSI can give you information about the trend. If it's below 30, you could consider buying the security, and if it’s over 70, it may be the time to take a short position. During strong trends, RSI can stay above 70 or below 30 for a longer time.
During a bull's market, the RSI usually oscillates between 40 and 90, and when it reaches 40-50, it defines the support level. On the other hand, when the bears take over the indicator oscillates between 10 and 60 with 50-60 mark indicating the resistance level.
Failure Swing Top and Failure Swing Bottom
Now, let's move to some RSI-related nuances. If an asset goes to a new high or falls to a new low, and an RSI hasn't confirmed the price movements during that time frame, this is often considered to be a trading signal for reversal.
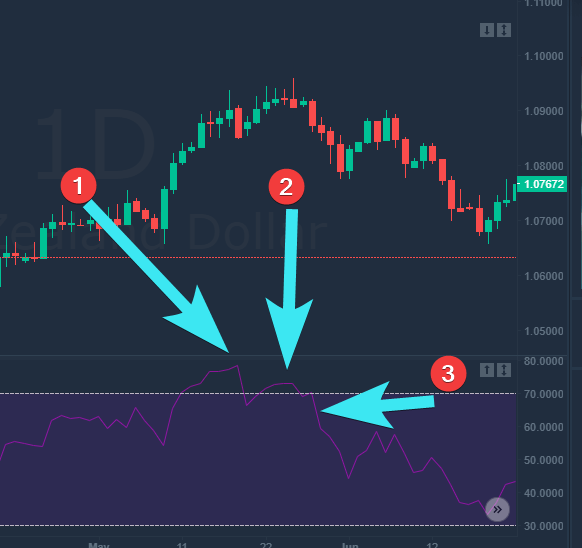
The RSI also has its version of double tops and double bottoms. Just take a look at the AUDNZD 1D chart below. If a local high (1) was not exceeded and is followed by a lower high (2), it's a good idea to take a short position at the point then RSI falls below the local low (3). This is called Failure Swing Top. A reverse situation is called a Failure Swing Bottom.
That's it from a practical point of view. The RSI signals appear when the indicator goes over 70 levels or under a 30 level. In the oversold levels, you may consider opening a BUY order, and in the overbought levels, you may consider opening a SELL order.
Now, let's take a look at AUDNZD in the last months. The RSI gave no strong signals in this period. However, it moved over 70 in April staying in "oversold" territory for a while.
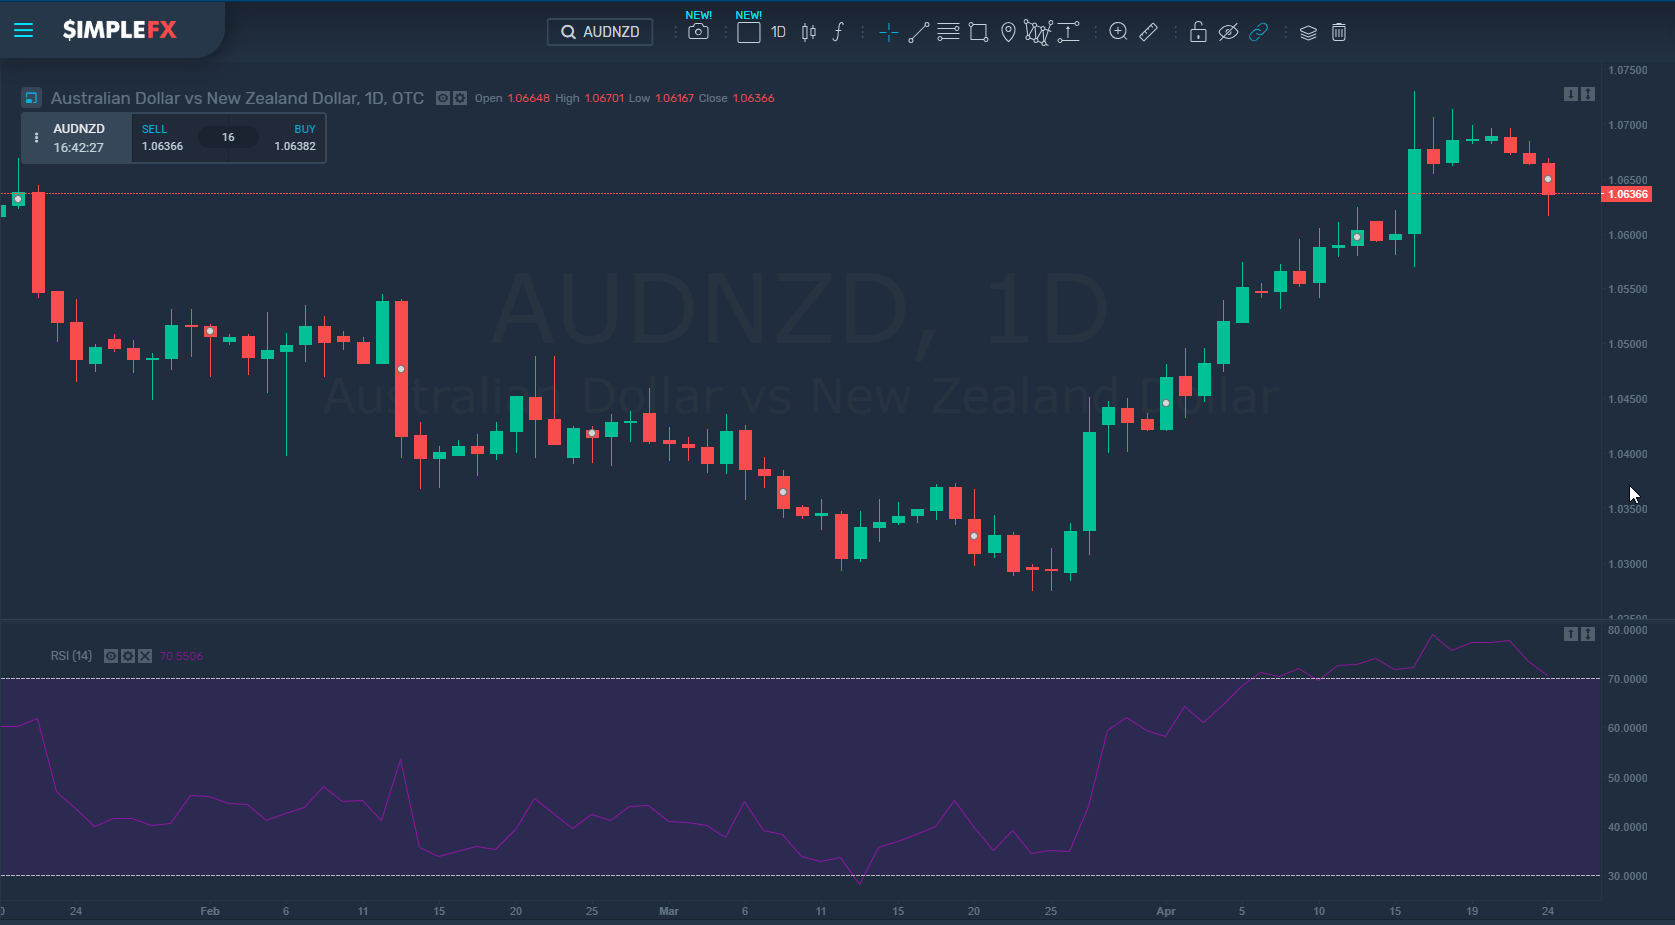
For those of you, who would like to learn how it works with this Forex pair, I’d recommend following the AUDNZD in the next days with the RSI indicator turned on.
Good luck trading!
Trading in the products and services of SimpleFX may result in losses as well as profits. In particular trading in leveraged products, such as but not limited to, cryptocurrency, foreign exchange, derivatives and commodities can be very speculative. Losses and profits may fluctuate both violently and rapidly.
Editors’ Picks

EUR/USD flirts with daily highs, retargets 1.1900
EUR/USD regains upside traction, returning to the 1.1880 zone and refocusing its attention to the key 1.1900 barrier. The pair’s slight gains comes against the backdrop of a humble decline in the US Dollar as investors continue to assess the latest US CPI readings and the potential Fed’s rate path.

GBP/USD remains well bid around 1.3650
GBP/USD maintains its upside momentum in place, hovering around daily highs near 1.3650 and setting aside part of the recent three-day drop. Cable’s improved sentiment comes on the back of the Greenback’s irresolute price action, while recent hawkish comments from the BoE’s Pill also collaborate with the uptick.

USD/JPY edges up above 153.50 with all eyes on US CPI figures
USD/JPY appreciates above 153.00 but remains on track for a 2.4% weekly loss. Trading volumes remain subdued on Friday, ahead of the IS CPI release. The Yen remains supported by hopes of a stable government and calls for further BoJ tightening.
Editors’ Picks

EUR/USD: Yes, the US economy is resilient – No, that won’t save the US Dollar Premium
Some impressive US data should have resulted in a much stronger USD. Well, it didn’t happen. The EUR/USD pair closed a third consecutive week little changed, a handful of pips above the 1.1800 mark.

Gold: Metals remain vulnerable to broad market mood Premium
Gold (XAU/USD) started the week on a bullish note and climbed above $5,000 before declining sharply and erasing its weekly gains on Thursday, only to recover heading into the weekend.

GBP/USD: Pound Sterling remains below 1.3700 ahead of UK inflation test Premium
The Pound Sterling (GBP) failed to resist at higher levels against the US Dollar (USD), but buyers held their ground amid a US data-busy blockbuster week.

Bitcoin: BTC bears aren’t done yet
Bitcoin (BTC) price slips below $67,000 at the time of writing on Friday, remaining under pressure and extending losses of nearly 5% so far this week.

US Dollar: Big in Japan Premium
The US Dollar (USD) resumed its yearly downtrend this week, slipping back to two-week troughs just to bounce back a tad in the second half of the week.
RECOMMENDED LESSONS
Making money in forex is easy if you know how the bankers trade!
I’m often mystified in my educational forex articles why so many traders struggle to make consistent money out of forex trading. The answer has more to do with what they don’t know than what they do know. After working in investment banks for 20 years many of which were as a Chief trader its second knowledge how to extract cash out of the market.
5 Forex News Events You Need To Know
In the fast moving world of currency markets where huge moves can seemingly come from nowhere, it is extremely important for new traders to learn about the various economic indicators and forex news events and releases that shape the markets. Indeed, quickly getting a handle on which data to look out for, what it means, and how to trade it can see new traders quickly become far more profitable and sets up the road to long term success.
Top 10 Chart Patterns Every Trader Should Know
Chart patterns are one of the most effective trading tools for a trader. They are pure price-action, and form on the basis of underlying buying and selling pressure. Chart patterns have a proven track-record, and traders use them to identify continuation or reversal signals, to open positions and identify price targets.
7 Ways to Avoid Forex Scams
The forex industry is recently seeing more and more scams. Here are 7 ways to avoid losing your money in such scams: Forex scams are becoming frequent. Michael Greenberg reports on luxurious expenses, including a submarine bought from the money taken from forex traders. Here’s another report of a forex fraud. So, how can we avoid falling in such forex scams?
What Are the 10 Fatal Mistakes Traders Make
Trading is exciting. Trading is hard. Trading is extremely hard. Some say that it takes more than 10,000 hours to master. Others believe that trading is the way to quick riches. They might be both wrong. What is important to know that no matter how experienced you are, mistakes will be part of the trading process.
The challenge: Timing the market and trader psychology
Successful trading often comes down to timing – entering and exiting trades at the right moments. Yet timing the market is notoriously difficult, largely because human psychology can derail even the best plans. Two powerful emotions in particular – fear and greed – tend to drive trading decisions off course.