![]() Stanislav Bernuhov
Stanislav Bernuhov
Common Sense Trading
Hi there!
Stan here, and today we will talk about the very specific topic - trading against the “weak money”. There’s been much said about “smart money”, “big market participants” and other “strong forces” of the market, which we’d like to be in sync with. However, such a situation is not always visible, and we have to monitor for short-term imbalances in the price action. Even if you want to follow the “smart money”, you’d still need to manage your risk, capturing short-term opportunities - at least to identify a good moment for entry. That’s what we are going to talk about in this article.
How does the “weak” move occur?
By “weak” moves, I assume ones which don’t have any support from the market: neither from big market participants nor from the “crowd”. Those moves may be visible and look like something meaningful, yet they are generated by mechanical trading engines. In case no other traders are ready to support the game, the “weak” move has very decent odds of being faded very soon. Smart traders know that and use the mentioned moves for building short-term counter-trend intraday trades with very limited risk.
The mechanical buying/selling
If you see price reacting exactly on a previous day’s high (low) or a high (low) of the recent trading session, odds are so that you are dealing with the” mechanical reaction”. In other words, a quick trading algorithm could have been involved in the action, but unlikely there was a trace of a big time frame player.
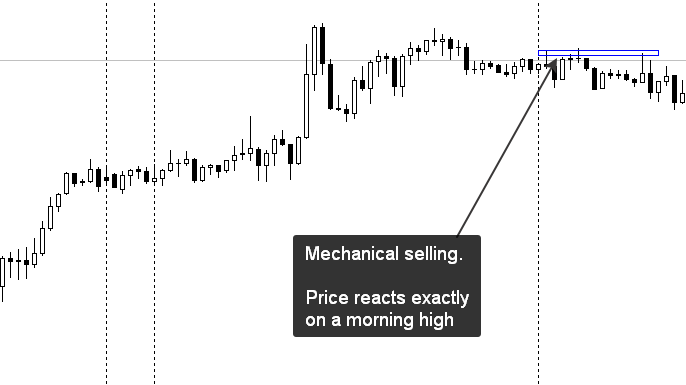
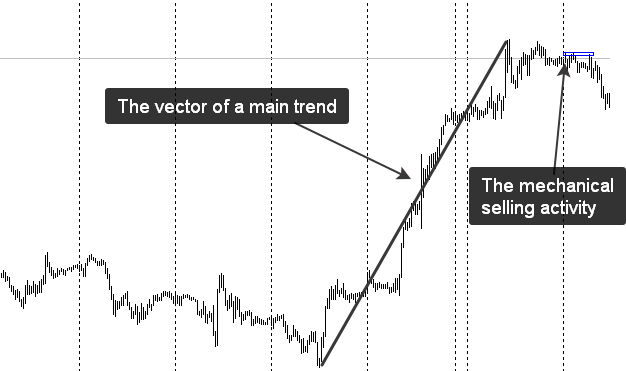
Your guess may be even more reliable if the “mechanical move” started during the inactive time of a trading session (for instance, one or two hours before the European session opening). Usually, big money doesn’t pay attention to such points as intraday highs and lows. There is a greater probability that we observe the activity of smaller forces. More often than not, it gives us the opportunity to confront that move, building a position in the opposite direction. You have greater odds of success if the previous intermediate-term trend is still active and it contradicts the “mechanical” move like shown below:
Trade location and risk calculation
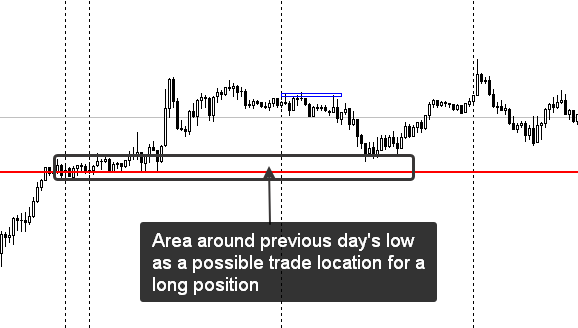
Trading is not just about entry points, but we still have to know how to identify them correctly. When is the “weak” move going to be exhausted? To answer this question, we should remember that markets are auctions: price moves until it the market perceives it as unfairly high (or low) - traders start to close their positions after that soon. In the case with a “weak money auction”, the potential of the move to continue diminishes as the price reaches the next reference - usually, an intraday high/low or a previous day’s high/low. It doesn’t mean that price would immediately reverse after reaching the mentioned point, but there you can build a counter-trend trade with a very limited risk (like it is shown below):
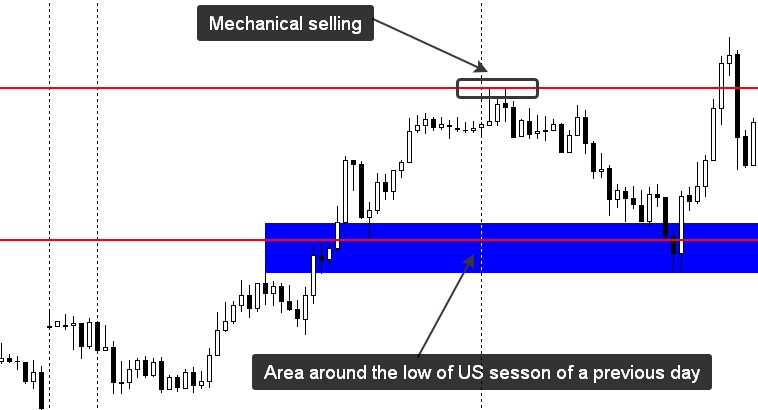
In the second example, I’ve taken the low from US session of a previous day. This is done so because the low of a previous day was quite far from the recent price action, and it would take more than a short-term mechanical impulse to get there. How wide should the area for a trade location be? Normally, I take the value of ATR(21) and add it to both sides of the reference point like it is shown below:
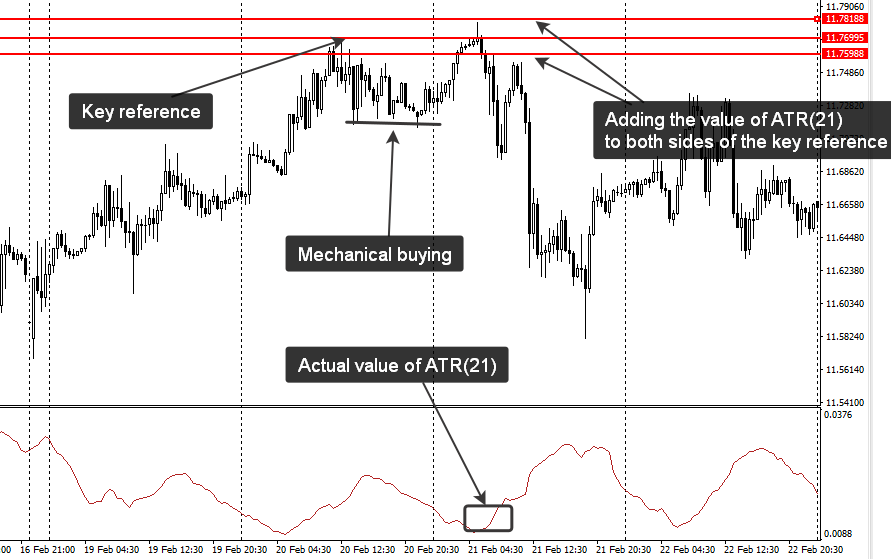
Stop-loss, in this case, may be placed beyond the area, which you build with the help of ATR(21). The lot size depends on your money management rules and should be calculated before you enter a position.
When the “weak money” wins
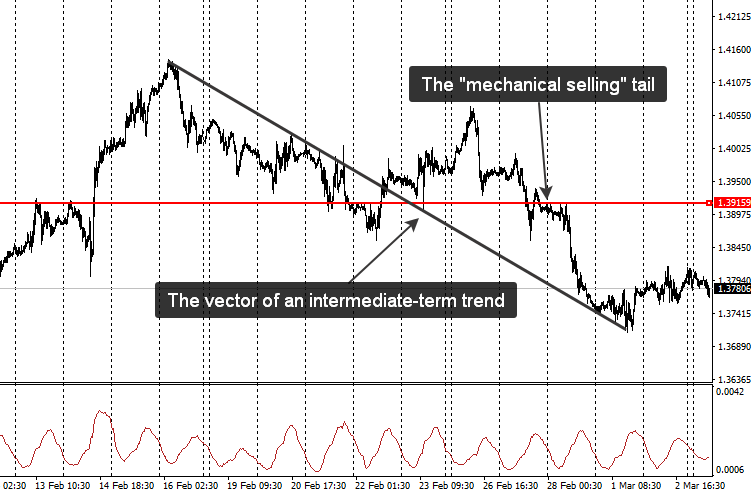
Sometimes it is not wise to oppose the mechanical selling or buying. You may already guess, that I’m talking about going against some intermediate-term trend. If you had one on the chart, it’s not recommended to go against the mechanical activity - such a trade might look as an easy one, but in fact, it’s not. Just take a look at the example below. Price was declining very quickly and in spite of a mechanical “selling tail”, there was a notable continuation after that. “Weak money” were acting under the protection of a strong trend (big money), that’s why it was unwise to oppose them back then.
So, be careful and manage your risk! In case you have any questions on the material published here, feel free to send me a request from my blog (accessible by the link in my account).
Good luck!
Trading the financial markets is associated with increased level of risk. Past performance is not indicative of future results. All materials are provided for educational purposes only and by no means may serve as a trading or investment advice.
Editors’ Picks

EUR/USD stays defensive below 1.1900 as USD recovers
EUR/USD trades in negative territory for the third consecutive day, below 1.1900 in the European session on Thursday. A modest rebound in the US Dollar is weighing on the pair, despite an upbeat market mood. Traders keep an eye on the US weekly Initial Jobless Claims data for further trading impetus.

GBP/USD holds above 1.3600 after UK data dump
\GBP/USD moves little while holding above 1.3600 in the European session on Thursday, following the release of the UK Q4 preliminary GDP, which showed a 0.1% growth against a 0.2% increase expected. The UK industrial sector activity deteriorated in Decembert, keeping the downward pressure intact on the Pound Sterling.

Japanese Yen strengthens on renewed verbal intervention
USD/JPY extends its losses for the fourth successive session, trading around 152.90 during the Asian hours on Thursday. The pair weakens as the Japanese Yen strengthens following renewed verbal intervention from Tokyo.
Editors’ Picks
GBP/USD holds above 1.3600 after UK data dump
\GBP/USD moves little while holding above 1.3600 in the European session on Thursday, following the release of the UK Q4 preliminary GDP, which showed a 0.1% growth against a 0.2% increase expected. The UK industrial sector activity deteriorated in Decembert, keeping the downward pressure intact on the Pound Sterling.
EUR/USD stays defensive below 1.1900 as USD recovers
EUR/USD trades in negative territory for the third consecutive day, below 1.1900 in the European session on Thursday. A modest rebound in the US Dollar is weighing on the pair, despite an upbeat market mood. Traders keep an eye on the US weekly Initial Jobless Claims data for further trading impetus.

Gold sticks to modest intraday losses as reduced March Fed rate cut bets underpin USD
Gold languishes near the lower end of its daily range heading into the European session on Thursday. The precious metal, however, lacks follow-through selling amid mixed cues and currently trades above the $5,050 level, well within striking distance of a nearly two-week low touched the previous day.

Cardano eyes short-term rebound as derivatives sentiment improves
Cardano (ADA) is trading at $0.257 at the time of writing on Thursday, after slipping more than 4% so far this week. Derivatives sentiment improves as ADA’s funding rates turn positive alongside rising long bets among traders.

A tale of two labour markets: Headline strength masks underlying weakness
Undoubtedly, yesterday’s delayed US January jobs report delivered a strong headline – one that surpassed most estimates. However, optimism quickly faded amid sobering benchmark revisions.
RECOMMENDED LESSONS
Making money in forex is easy if you know how the bankers trade!
I’m often mystified in my educational forex articles why so many traders struggle to make consistent money out of forex trading. The answer has more to do with what they don’t know than what they do know. After working in investment banks for 20 years many of which were as a Chief trader its second knowledge how to extract cash out of the market.
5 Forex News Events You Need To Know
In the fast moving world of currency markets where huge moves can seemingly come from nowhere, it is extremely important for new traders to learn about the various economic indicators and forex news events and releases that shape the markets. Indeed, quickly getting a handle on which data to look out for, what it means, and how to trade it can see new traders quickly become far more profitable and sets up the road to long term success.
Top 10 Chart Patterns Every Trader Should Know
Chart patterns are one of the most effective trading tools for a trader. They are pure price-action, and form on the basis of underlying buying and selling pressure. Chart patterns have a proven track-record, and traders use them to identify continuation or reversal signals, to open positions and identify price targets.
7 Ways to Avoid Forex Scams
The forex industry is recently seeing more and more scams. Here are 7 ways to avoid losing your money in such scams: Forex scams are becoming frequent. Michael Greenberg reports on luxurious expenses, including a submarine bought from the money taken from forex traders. Here’s another report of a forex fraud. So, how can we avoid falling in such forex scams?
What Are the 10 Fatal Mistakes Traders Make
Trading is exciting. Trading is hard. Trading is extremely hard. Some say that it takes more than 10,000 hours to master. Others believe that trading is the way to quick riches. They might be both wrong. What is important to know that no matter how experienced you are, mistakes will be part of the trading process.
The challenge: Timing the market and trader psychology
Successful trading often comes down to timing – entering and exiting trades at the right moments. Yet timing the market is notoriously difficult, largely because human psychology can derail even the best plans. Two powerful emotions in particular – fear and greed – tend to drive trading decisions off course.