This post probes the complex interplay between sunspot activity and market prices, questioning the oversimplified view of solar maximums and minimums as mere guiding US stock market trends or pivot triggers. We at Gann Explained delve into this nuanced connection, utilizing historical data from solar cycles 21-24 to shed light on the potential influences of the current Solar Cycle 25 on the 2024 market trend.
The never-revealed secret: Influence of solar cycles on the financial market explained
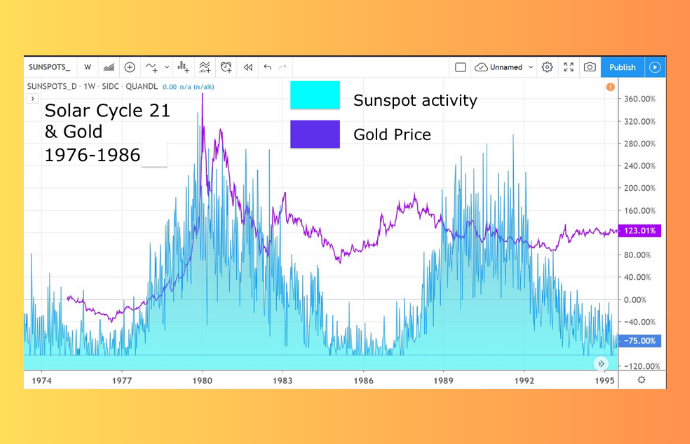
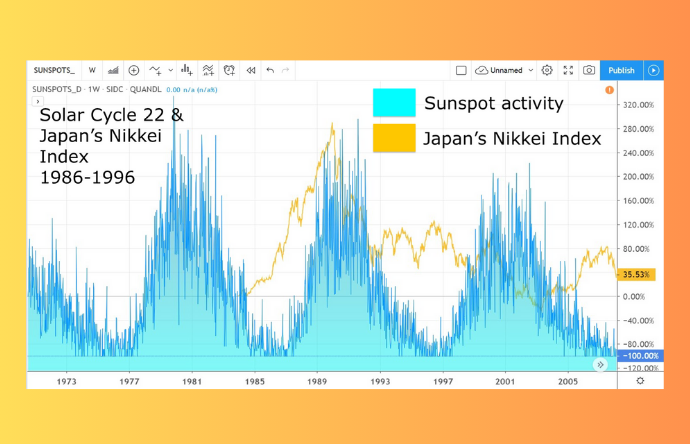
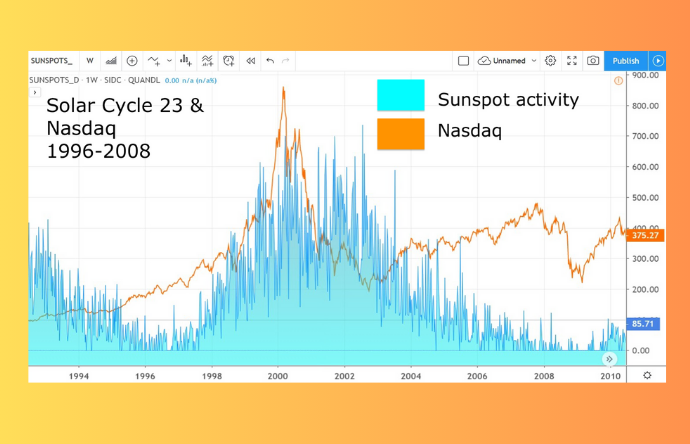
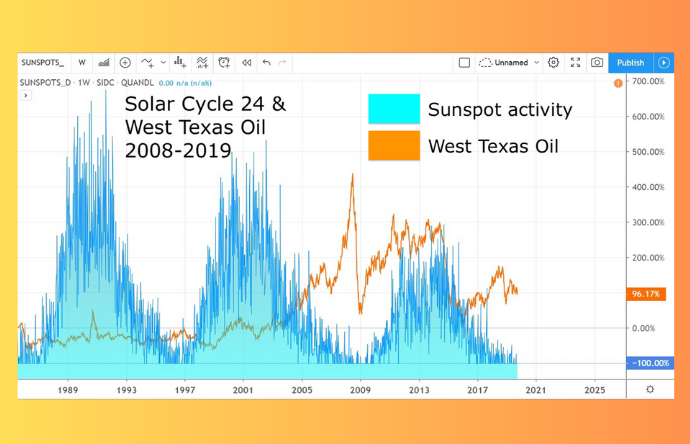
The Solar Cycle doesn't directly dictate stock market trends. Instead, each solar maximum and minimum uniquely align with the peaks and bottoms of specific financial assets. For instance, Gold, the Nikkei Index, Nasdaq, and West Texas oil have each demonstrated distinct correlations with solar cycles 21, 22, 23, and 24, respectively.
Solar Cycle 21 and Gold: A clear correlation between sunspot activity and gold prices was observed, with price movements echoing solar patterns.
Solar Cycle 22 and Japan’s Nikkei Index: This cycle saw the Nikkei Index's performance aligning with sunspot activity trends.
Solar Cycle 23 & Nasdaq: Nasdaq's rise and fall mirrored the solar activity, particularly during the dot-com bubble.
Solar Cycle 24 and West Texas Oil: Oil prices reflected the solar cycle's pattern, with similar growth and decay phases.
Market outlook by gann explained: Tracking solar cycle 25's market influence in 2024
Solar Cycle 25 commenced with its solar minimum phase in 2020, and with NOAA's recent projections pointing to a peak between January and October 2024, the question arises: how will this influence the market?
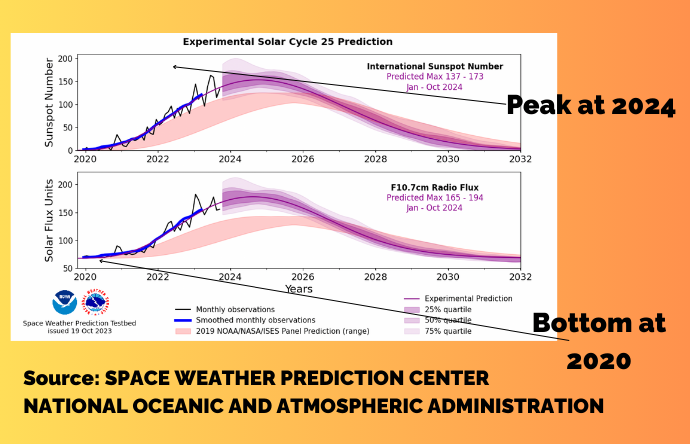
Pro-Tip: To conduct this analysis and projection, we assess a broad spectrum of financial assets. We focus on identifying those who experienced their lowest points in 2020 and are currently on a consistent upward trajectory, reaching new highs or approaching their peak during this ongoing phase.
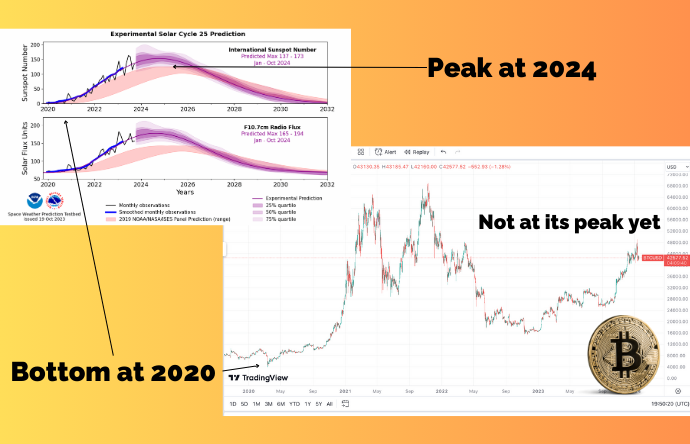
Bitcoin and Solar Cycle 25: Currently, Bitcoin does not show a clear alignment with the Sunspot cycle, presenting an anomaly in the pattern.
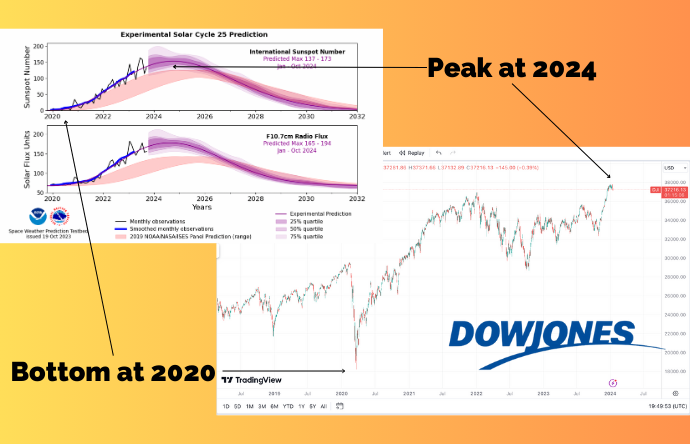
Dow Jones Industrial Average: The Dow experienced lows in early 2020 and is currently peaking, possibly in sync with the solar cycle.
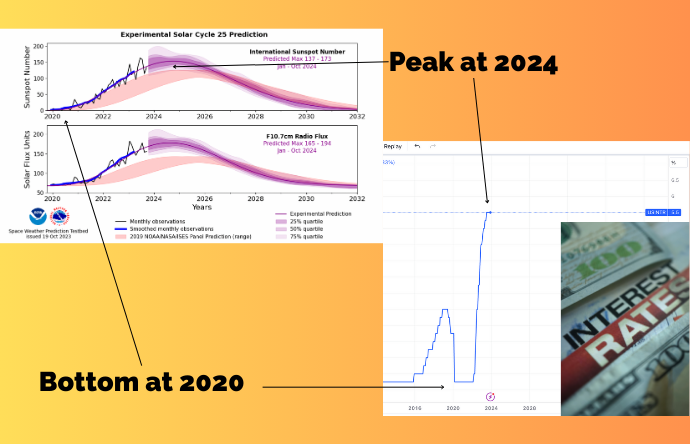
US Interest Rates: Similar to the Dow, interest rates bottomed in early 2020 and are now rising, possibly following the solar pattern.
3 Tips for Trading in Solar Cycle 25
#1. Stay Updated with NOAA Forecasts: Regularly check the NOAA's monthly updated sunspot forecasts to stay ahead.
#2. Match Financial Assets with Solar Cycles: Identify and track the price movements of assets that correlate with Solar Cycle 25. Remember, the impact of this cycle will eventually diminish, underlining the importance of deepening your understanding of cyclical influences in the market
#3. Expand Your Perspective: This analysis aims to provide W.D. Gann traders with an expanded understanding of Gann's cycle theory, particularly in its connection to the narrative elements like the Appearance, Disappearance, and Reappearance of Marie in "The Tunnel Thru the Air." At Gann Explained, our mission is to offer a fresh perspective on Gann's work, going beyond a literal interpretation of his texts and delving into the deeper, more nuanced meanings and applications in trading strategies.
Conclusion:
While the Solar Cycle's influence on markets is not a straightforward cause-and-effect relationship, its correlation with financial trends cannot be overlooked. By understanding and incorporating these natural cycles into market analysis, you can gain a unique perspective and edge in your investing and trading.
Next Steps:
To determine if the stocks, indices, or commodities in your portfolio align with the solar maxima and minima of Solar Cycle 25, look into whether they experienced a significant low in early 2020 and are currently peaking or making new highs. It's crucial to remember that the influence of this cycle may not be constant and will switch off. Always stay mindful of your risk tolerance and ensure you implement a stop-loss strategy for added security.
Khit Wong and all members of Gann Explained LLC are NOT financial advisors, and nothing they say is meant to be a recommendation to buy or sell any financial instrument. All information is strictly educational and/or opinion. By reading this, you agree to all of the following: You understand this to be an expression of opinions and not professional advice. Any opinions, news, research, analysis, prices, or other information contained on this website is provided as general market commentary and education and does not constitute advice. The brand name of Gann Explained LLC will not accept liability for any loss or damage, including without limitation any loss of profit, which may arise directly or indirectly from the use of or reliance on such information. You are solely responsible for the use of any content and hold Khit Wong, Gann Explained LLC all members harmless in any event or claim. FTC DISCLOSURE: Any income claims shared by myself, students, friends, or clients are understood to be true and accurate but are not verified in any way. Always do your own due diligence and use your own judgment when making buying decisions and investments in your business.
Editors’ Picks

EUR/USD ticks higher to near 1.1800 ahead of flash German inflation data
The EUR/USD pair trades marginally higher to near 1.1810 in the late Asian trading session on Friday, ahead of the release of preliminary inflation data for February from Germany and its major states during the day.

GBP/USD struggles to lure buyers amid UK political drama, BoE easing bias
The GBP/USD pair struggles to build on the overnight modest bounce from the 1.3445 area, or the weekly low, and oscillates in a narrow band during the Asian session on Friday. Spot prices currently trade just below the 1.3500 psychological mark, nearly unchanged for the day, and seem vulnerable to slide further.

USD/JPY falls back below 156.00 as Tokyo CPI backs BoJ's hawkish outlook
USD/JPY attracts fresh sellers for the second straight day following the release of Tokyo CPI, which grew slightly more than expected in February. This comes on top of hawkish comments by BoJ officials and backs the case for further policy tightening, providing a modest lift to the Japanese Yen. Apart from this, sustained safe-haven buying, amid trade-related uncertainties and geopolitical tensions, benefits the JPY's safe-haven status. However, reduced Fed rate cut bets underpin the US Dollar and could help limit losses for the currency pair.
Editors’ Picks
EUR/USD ticks higher to near 1.1800 ahead of flash German inflation data
The EUR/USD pair trades marginally higher to near 1.1810 in the late Asian trading session on Friday, ahead of the release of preliminary inflation data for February from Germany and its major states during the day.
GBP/USD struggles to lure buyers amid UK political drama, BoE easing bias
The GBP/USD pair struggles to build on the overnight modest bounce from the 1.3445 area, or the weekly low, and oscillates in a narrow band during the Asian session on Friday. Spot prices currently trade just below the 1.3500 psychological mark, nearly unchanged for the day, and seem vulnerable to slide further.

Gold awaits acceptance above $5,200 and US PPI data
Gold consolidates previous rebound near $5,200 amid risk-off markets, awaiting US PPI release. The US Dollar eyes a flattish weekly close as dovish Fed outlook and tariff woes outweigh geopolitical risks. Gold yearns for acceptance above $5,200 to resume the uptrend, with a bullish RSI in play.

Bitcoin, Ethereum and Ripple consolidate with short-term cautious bullish bias
Bitcoin, Ethereum and Ripple are consolidating near key technical areas on Friday, showing mild signs of stabilization after recent volatility. BTC holds above $67,000 despite mild losses so far this week, while ETH hovers around $2,000 after a rejection near its upper consolidation boundary.

Changing the game: International implications of recent tariff developments
The Supreme Court ruling on International Emergency Economic Powers Act (IEEPA) tariffs provides limited relief for the rest of the world, with weighted average tariff rates modestly lower.
RECOMMENDED LESSONS
Making money in forex is easy if you know how the bankers trade!
I’m often mystified in my educational forex articles why so many traders struggle to make consistent money out of forex trading. The answer has more to do with what they don’t know than what they do know. After working in investment banks for 20 years many of which were as a Chief trader its second knowledge how to extract cash out of the market.
5 Forex News Events You Need To Know
In the fast moving world of currency markets where huge moves can seemingly come from nowhere, it is extremely important for new traders to learn about the various economic indicators and forex news events and releases that shape the markets. Indeed, quickly getting a handle on which data to look out for, what it means, and how to trade it can see new traders quickly become far more profitable and sets up the road to long term success.
Top 10 Chart Patterns Every Trader Should Know
Chart patterns are one of the most effective trading tools for a trader. They are pure price-action, and form on the basis of underlying buying and selling pressure. Chart patterns have a proven track-record, and traders use them to identify continuation or reversal signals, to open positions and identify price targets.
7 Ways to Avoid Forex Scams
The forex industry is recently seeing more and more scams. Here are 7 ways to avoid losing your money in such scams: Forex scams are becoming frequent. Michael Greenberg reports on luxurious expenses, including a submarine bought from the money taken from forex traders. Here’s another report of a forex fraud. So, how can we avoid falling in such forex scams?
What Are the 10 Fatal Mistakes Traders Make
Trading is exciting. Trading is hard. Trading is extremely hard. Some say that it takes more than 10,000 hours to master. Others believe that trading is the way to quick riches. They might be both wrong. What is important to know that no matter how experienced you are, mistakes will be part of the trading process.
The challenge: Timing the market and trader psychology
Successful trading often comes down to timing – entering and exiting trades at the right moments. Yet timing the market is notoriously difficult, largely because human psychology can derail even the best plans. Two powerful emotions in particular – fear and greed – tend to drive trading decisions off course.