![]() Elliott Wave Forecast Team
Elliott Wave Forecast Team
ElliottWave-Forecast.com
There are several different momentum indicators. One of the popular ones is the RSI (Relative Strength Index) which was developed in 1978 by J. Welles Wilder. The RSI is in the form of an oscillator from 0 to 100. Traditional interpretation suggests RSI of 70 or above signifies overbought condition. Meanwhile, RSI of 30 or below indicates oversold condition. Elliott Wave Theory on the other hand is a different form of technical analysis which was developed much earlier than RSI in 1930s by Ralph Nelson Elliott. It looks at the price patterns and structures to identify investor sentiment and psychology and forecast the future path. The theory identifies 5 waves impulse which sets up the trend. Corrective waves that oppose the larger trend on the other hand develop in 3 waves. Since Elliott Wave Theory is older than the RSI, there is no linkage between the two different methods in the original usage.
As one of the leading service providers, Elliott Wave Forecast (EWF) finds a different way to use RSI with Elliott Wave. We don’t use it to identify overbought or oversold condition. These are the guidelines we use on RSI at EWF and how they will have different conclusion to the traditional understanding:
Wave 3 in Elliott Wave Theory typically is the strongest wave. In a bullish market, RSI of wave 3 often continues to stay at an overbought region (>70). A traditional understanding of RSI suggests if RSI is over 70, it is overbought and thus traders might sell it. However, we do not recommend selling wave 3. In fact, an extended period of RSI above 70 signals that the trend is in that direction and thus it’s better to buy the dips rather than trying to pick the top and sell.
Wave 5 in Elliott Wave Theory typically comes with momentum divergence. In a bullish market, this means price makes a higher high while momentum (RSI) makes a lower high. With the traditional understanding, momentum divergence suggests it’s bearish and instrument can selloff. In our view however, a momentum divergence in an uptrend suggests the prevailing trend is bullish as divergence occurs in wave 5 and a 5 waves structure defines the trend’s direction. Thus, even though instrument can do 3 waves pullback after the end of wave 5, if the prevailing trend is bullish, it’s better to buy the dips rather than picking the top and selling wave 5.
A divergence also happens in the fifth swing of a 7 swing structure. A 7 swing structure is called a double correction or WXY. Sometimes people call it a double zigzag if the internal of wave W and Y happen to be both a zigzag. In a 7 swing double three structure, the fifth swing should come with a divergence like the graph below shows:
Double three structure
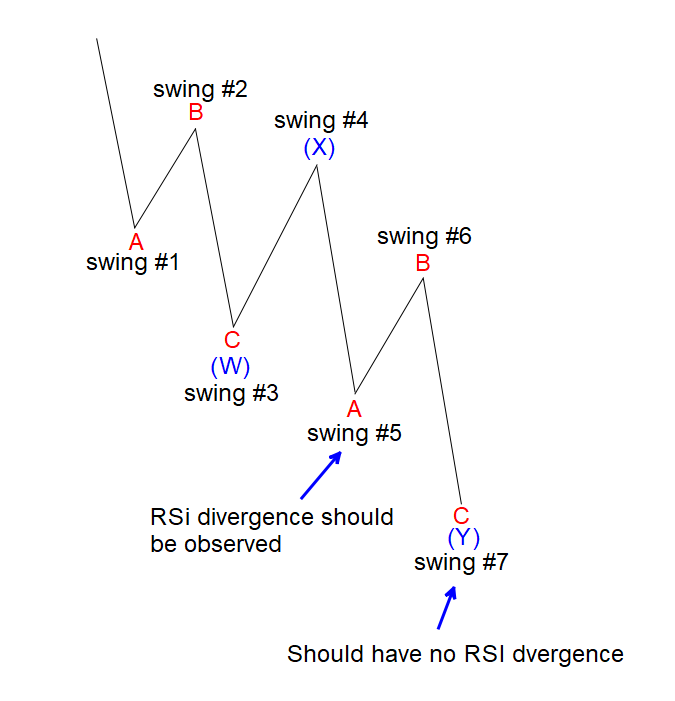
As the graph above shows, when the structure forms a 5 swing lower, swing #5 should come with momentum divergence. In other words, at that point, price makes lower low, but RSI makes a higher low. In the traditional interpretation, a momentum divergence like this signals it’s bullish. Even though it’s partially true that we expect instrument to rally in swing #6, but the fact there’s a divergence in swing #5 suggests the prevailing trend is not complete yet to the downside. Thus instead of trying to buy the divergence, it’ll be better to sell the rally as the prevailing trend in this case is to the downside to end 7 swing structure. Every corrective structure, whether it’s a 3 swing ABC, or 7 swing WXY, per guideline, normally ends without a divergence.
At EWF, we use RSI divergence to check if instrument is in wave 5. We also use it to check if the structure is an incomplete 7 swing structure. For example, if an instrument erases divergence, then that can lead us to switch the count and no longer calling it to be wave 5. An instrument in this case can be still in wave 3 with extended wave 3 or a nest. These are just some of the ways we use RSI with Elliott Wave.
FURTHER DISCLOSURES AND DISCLAIMER CONCERNING RISK, RESPONSIBILITY AND LIABILITY Trading in the Foreign Exchange market is a challenging opportunity where above average returns are available for educated and experienced investors who are willing to take above average risk. However, before deciding to participate in Foreign Exchange (FX) trading, you should carefully consider your investment objectives, level of xperience and risk appetite. Do not invest or trade capital you cannot afford to lose. EME PROCESSING AND CONSULTING, LLC, THEIR REPRESENTATIVES, AND ANYONE WORKING FOR OR WITHIN WWW.ELLIOTTWAVE- FORECAST.COM is not responsible for any loss from any form of distributed advice, signal, analysis, or content. Again, we fully DISCLOSE to the Subscriber base that the Service as a whole, the individual Parties, Representatives, or owners shall not be liable to any and all Subscribers for any losses or damages as a result of any action taken by the Subscriber from any trade idea or signal posted on the website(s) distributed through any form of social-media, email, the website, and/or any other electronic, written, verbal, or future form of communication . All analysis, trading signals, trading recommendations, all charts, communicated interpretations of the wave counts, and all content from any media form produced by www.Elliottwave-forecast.com and/or the Representatives are solely the opinions and best efforts of the respective author(s). In general Forex instruments are highly leveraged, and traders can lose some or all of their initial margin funds. All content provided by www.Elliottwave-forecast.com is expressed in good faith and is intended to help Subscribers succeed in the marketplace, but it is never guaranteed. There is no “holy grail” to trading or forecasting the market and we are wrong sometimes like everyone else. Please understand and accept the risk involved when making any trading and/or investment decision. UNDERSTAND that all the content we provide is protected through copyright of EME PROCESSING AND CONSULTING, LLC. It is illegal to disseminate in any form of communication any part or all of our proprietary information without specific authorization. UNDERSTAND that you also agree to not allow persons that are not PAID SUBSCRIBERS to view any of the content not released publicly. IF YOU ARE FOUND TO BE IN VIOLATION OF THESE RESTRICTIONS you or your firm (as the Subscriber) will be charged fully with no discount for one year subscription to our Premium Plus Plan at $1,799.88 for EACH person or firm who received any of our content illegally through the respected intermediary’s (Subscriber in violation of terms) channel(s) of communication.
Editors’ Picks

EUR/USD flirts with daily highs, retargets 1.1900
EUR/USD regains upside traction, returning to the 1.1880 zone and refocusing its attention to the key 1.1900 barrier. The pair’s slight gains comes against the backdrop of a humble decline in the US Dollar as investors continue to assess the latest US CPI readings and the potential Fed’s rate path.

GBP/USD remains well bid around 1.3650
GBP/USD maintains its upside momentum in place, hovering around daily highs near 1.3650 and setting aside part of the recent three-day drop. Cable’s improved sentiment comes on the back of the Greenback’s irresolute price action, while recent hawkish comments from the BoE’s Pill also collaborate with the uptick.

USD/JPY edges up above 153.50 with all eyes on US CPI figures
USD/JPY appreciates above 153.00 but remains on track for a 2.4% weekly loss. Trading volumes remain subdued on Friday, ahead of the IS CPI release. The Yen remains supported by hopes of a stable government and calls for further BoJ tightening.
Editors’ Picks

EUR/USD: Yes, the US economy is resilient – No, that won’t save the US Dollar Premium
Some impressive US data should have resulted in a much stronger USD. Well, it didn’t happen. The EUR/USD pair closed a third consecutive week little changed, a handful of pips above the 1.1800 mark.

Gold: Metals remain vulnerable to broad market mood Premium
Gold (XAU/USD) started the week on a bullish note and climbed above $5,000 before declining sharply and erasing its weekly gains on Thursday, only to recover heading into the weekend.

GBP/USD: Pound Sterling remains below 1.3700 ahead of UK inflation test Premium
The Pound Sterling (GBP) failed to resist at higher levels against the US Dollar (USD), but buyers held their ground amid a US data-busy blockbuster week.

Bitcoin: BTC bears aren’t done yet
Bitcoin (BTC) price slips below $67,000 at the time of writing on Friday, remaining under pressure and extending losses of nearly 5% so far this week.

US Dollar: Big in Japan Premium
The US Dollar (USD) resumed its yearly downtrend this week, slipping back to two-week troughs just to bounce back a tad in the second half of the week.
RECOMMENDED LESSONS
Making money in forex is easy if you know how the bankers trade!
I’m often mystified in my educational forex articles why so many traders struggle to make consistent money out of forex trading. The answer has more to do with what they don’t know than what they do know. After working in investment banks for 20 years many of which were as a Chief trader its second knowledge how to extract cash out of the market.
5 Forex News Events You Need To Know
In the fast moving world of currency markets where huge moves can seemingly come from nowhere, it is extremely important for new traders to learn about the various economic indicators and forex news events and releases that shape the markets. Indeed, quickly getting a handle on which data to look out for, what it means, and how to trade it can see new traders quickly become far more profitable and sets up the road to long term success.
Top 10 Chart Patterns Every Trader Should Know
Chart patterns are one of the most effective trading tools for a trader. They are pure price-action, and form on the basis of underlying buying and selling pressure. Chart patterns have a proven track-record, and traders use them to identify continuation or reversal signals, to open positions and identify price targets.
7 Ways to Avoid Forex Scams
The forex industry is recently seeing more and more scams. Here are 7 ways to avoid losing your money in such scams: Forex scams are becoming frequent. Michael Greenberg reports on luxurious expenses, including a submarine bought from the money taken from forex traders. Here’s another report of a forex fraud. So, how can we avoid falling in such forex scams?
What Are the 10 Fatal Mistakes Traders Make
Trading is exciting. Trading is hard. Trading is extremely hard. Some say that it takes more than 10,000 hours to master. Others believe that trading is the way to quick riches. They might be both wrong. What is important to know that no matter how experienced you are, mistakes will be part of the trading process.
The challenge: Timing the market and trader psychology
Successful trading often comes down to timing – entering and exiting trades at the right moments. Yet timing the market is notoriously difficult, largely because human psychology can derail even the best plans. Two powerful emotions in particular – fear and greed – tend to drive trading decisions off course.