![]() Elliott Wave Forecast Team
Elliott Wave Forecast Team
ElliottWave-Forecast.com
The stock market has been around for centuries. Movement in stock market is influenced by the demand vs supply factor. The simple way to explain equity market is the aggregation of buyers and sellers of stocks. It represents a percentage of claims on businesses. These may include securities listed on a public stock exchange as well as stock that is only traded privately. Privately traded stocks include shares of private companies which are sold to an investor through trading platforms.
The Elliott Wave Theory was developed in the 1930s by Ralph Nelson Elliott. It was an analysis in greater depth of market behavior and how the patterns repeat itself. It is pretty simple when someone reads the Theory and understand the basic patterns. At the same time, it was an amazing discovery and has been applied as a strategy for millions of traders worldwide. The Theory’s main pattern states that the trend always moves in five waves. This is often referred to as an impulse which consists of five waves. The market will then pull back in three waves to correct the cycle and then continue in the direction of the five waves. For reference, please click on the following link to understand all the patterns within the Theory. It is a straightforward concept with three main rules and can provide a lot of profit if applied correctly. As we mentioned above, the Theory was developed in the 1930s, so our work has changed a lot. Even though the main factor of supply and demand still remains the same, market execution has changed. We need to imagine how hard it was 75 years ago to execute a trade and how few people across the planet could trade. Based on the first share owner census undertaken by the New York Stock Exchange (NYSE) in 1952, only 6.5 million Americans owned common stock. So this represents only 4.2% of the US population. Nowadays, according to Gallup, around 61% Americans own stocks. There is no question that technology has made it easier for traders to enter the Market. Personal computers and the Internet have opened a huge avenue to access the Market. More people trading means more daily volume and more money to be made overall.
Technology plays a huge role in our lives. From social media, internet, and business operations, everything has been affected by technology. It’s naive to believe that technology has not played a role in market execution and how the Human Factor has been taking it away from the simple Market Nature. In the past, a person bought stock through a bank or a broker and depending on the volume, the stock move in one direction or another. We have long suspected that computers have changed the market. High-Frequency Trading computers have made buying and selling very fast. We at EWF developed a system that aligns the old Elliott Wave Theory with the high-frequency trading of today’s Market. We analyzed the waves and the patterns and used the Theory as a language to get the sequences. The sequences allow traders to trade the right side. When the Market is correct, it is always moving in three, seven, and eleven in the simple sequences. We located the area and presented it to members as the Blue Box area.
Here are some examples of the Blue Boxes.
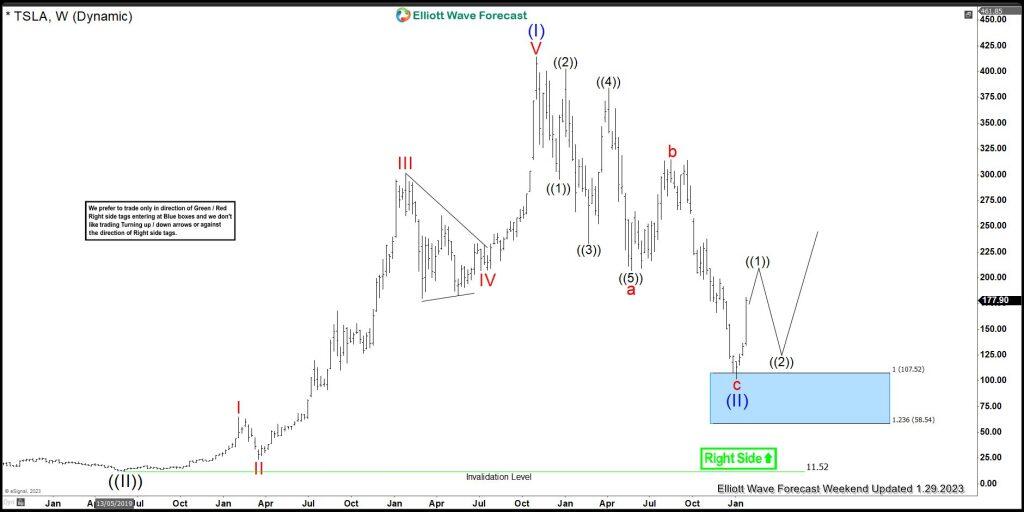
Tesla ($TSLA) corrects the Grand Super Cycle and trades lower since the peak in 2022 in a simple ABC or Three waves. We presented to members the Blue Box area, where our members will enter the Market. The blue box is where both buyers and sellers agree in a direction. The concept is simple, sellers push lower until the top of the Blue Box and using the Box to take profit. On the other hand, buyers wait to enter at the top of the blue box. Computers nowadays are the traders because it is impossible to trade every mini second.
Here is TESLA Weekly Chart showing the Buying area.
$TSLA weekly Elliott Wave chart
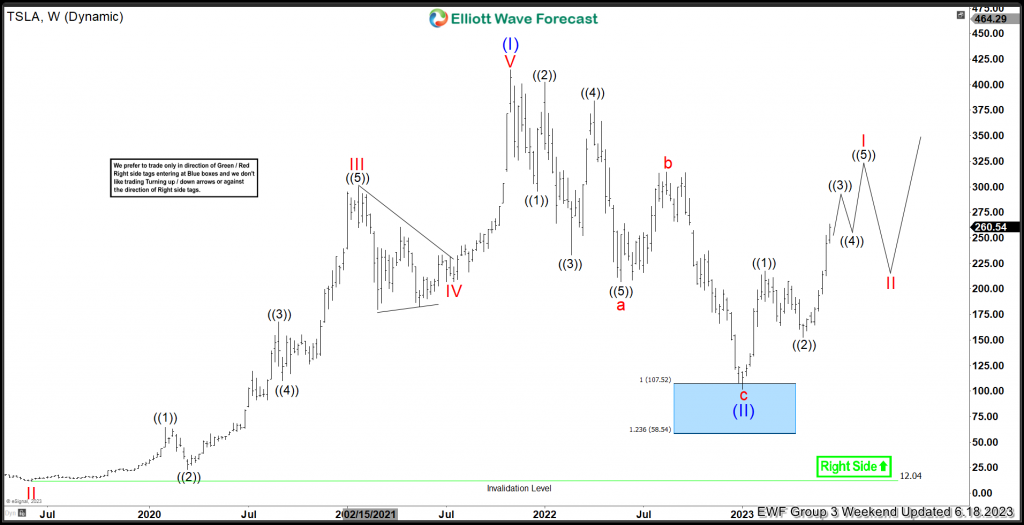
Here is Tesla showing the reaction from the blue box area:
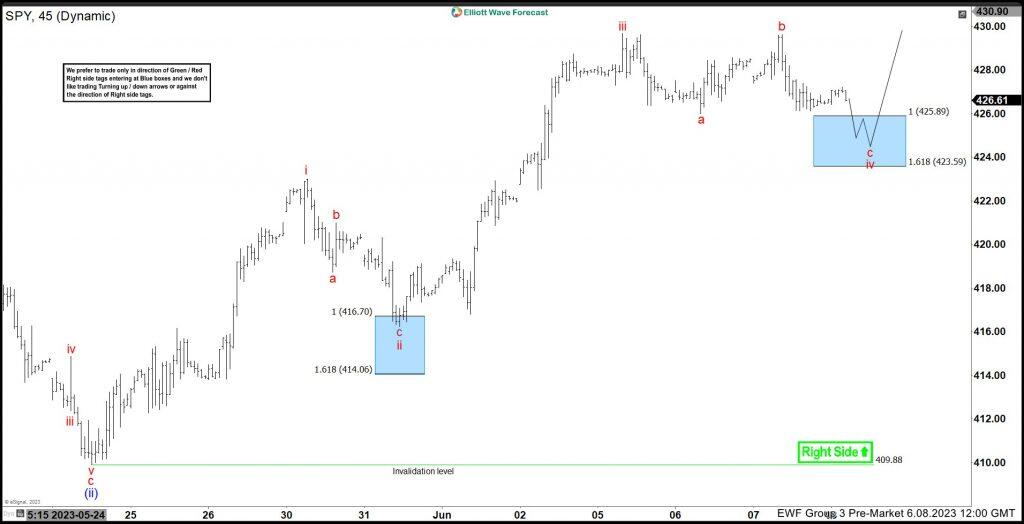
Another example is $SPY, which has been trending higher within the cycle since 10.13.2022 and the shorter cycle since 03.2023. The Index pullback in three waves within the impulse in wave iv. Our members know the blue box area which is the high-frequency trading area.
Here is SPY presented to members on 06.08.2023, expecting the Instrument to reach the High- Frequency Trading area.
$SPY 1 hour Elliott Wave chart
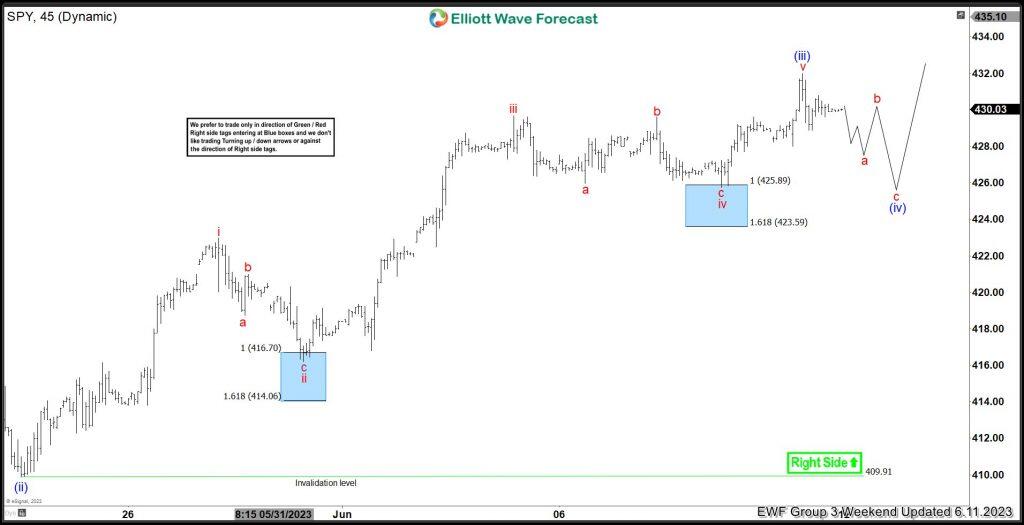
Here is SPY reacting off the blue box High-Frequency Trading area. The Index reacted higher in wave ii and wave iv.
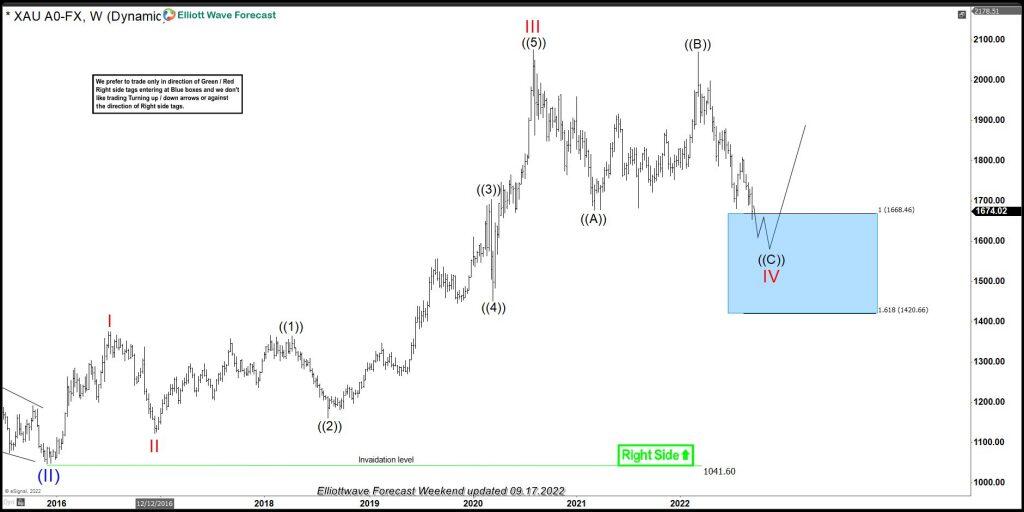
Another example is Gold, which corrected the cycle in the weekly chart and made a simple ABC pullback. The metal was targeting the blue box area, where buyers were waiting.
Here is the Weekly chart showing the expected blue box area.
Gold ($XAU/USD) weekly Elliott Wave
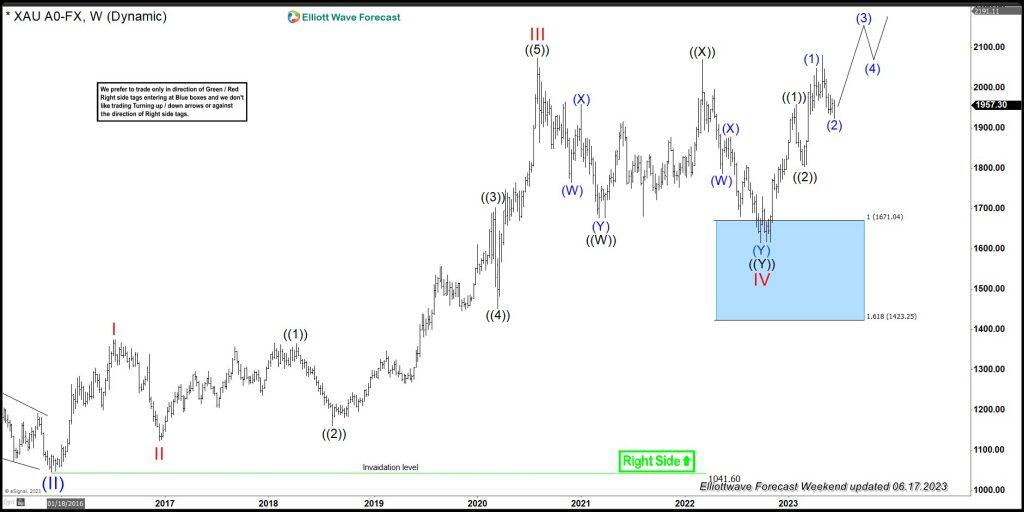
Here is the latest Weekly chart showing the tremendous reaction off the blue box area.
In conclusion, the Market has changed over years and computers have changed the way trading operates. The market has turned into very defined areas. Those areas are defined ahead of time, and the moment the connector within the correction happens, the areas present itself. At that moment, the corrective side keeps pushing into the box, and the right side waits at the box and enters the Market.
We want to make it clear that reaching the Blue Box does not mean a winning trade. It means that a reaction should happen because when market corrects, it moves in three, seven, and eleven swing. The Boxes sometimes create a reaction after three waves, then push for the seven. But as far as the main cycle pivot hold, always enter with the right side in three, seven, and eleven, which means having the High-Frequency Trading in your side.
FURTHER DISCLOSURES AND DISCLAIMER CONCERNING RISK, RESPONSIBILITY AND LIABILITY Trading in the Foreign Exchange market is a challenging opportunity where above average returns are available for educated and experienced investors who are willing to take above average risk. However, before deciding to participate in Foreign Exchange (FX) trading, you should carefully consider your investment objectives, level of xperience and risk appetite. Do not invest or trade capital you cannot afford to lose. EME PROCESSING AND CONSULTING, LLC, THEIR REPRESENTATIVES, AND ANYONE WORKING FOR OR WITHIN WWW.ELLIOTTWAVE- FORECAST.COM is not responsible for any loss from any form of distributed advice, signal, analysis, or content. Again, we fully DISCLOSE to the Subscriber base that the Service as a whole, the individual Parties, Representatives, or owners shall not be liable to any and all Subscribers for any losses or damages as a result of any action taken by the Subscriber from any trade idea or signal posted on the website(s) distributed through any form of social-media, email, the website, and/or any other electronic, written, verbal, or future form of communication . All analysis, trading signals, trading recommendations, all charts, communicated interpretations of the wave counts, and all content from any media form produced by www.Elliottwave-forecast.com and/or the Representatives are solely the opinions and best efforts of the respective author(s). In general Forex instruments are highly leveraged, and traders can lose some or all of their initial margin funds. All content provided by www.Elliottwave-forecast.com is expressed in good faith and is intended to help Subscribers succeed in the marketplace, but it is never guaranteed. There is no “holy grail” to trading or forecasting the market and we are wrong sometimes like everyone else. Please understand and accept the risk involved when making any trading and/or investment decision. UNDERSTAND that all the content we provide is protected through copyright of EME PROCESSING AND CONSULTING, LLC. It is illegal to disseminate in any form of communication any part or all of our proprietary information without specific authorization. UNDERSTAND that you also agree to not allow persons that are not PAID SUBSCRIBERS to view any of the content not released publicly. IF YOU ARE FOUND TO BE IN VIOLATION OF THESE RESTRICTIONS you or your firm (as the Subscriber) will be charged fully with no discount for one year subscription to our Premium Plus Plan at $1,799.88 for EACH person or firm who received any of our content illegally through the respected intermediary’s (Subscriber in violation of terms) channel(s) of communication.
Editors’ Picks

EUR/USD: US Dollar to remain pressured until uncertainty fog dissipates
Unimpressive European Central Bank left monetary policy unchanged for the fifth consecutive meeting. The United States first-tier employment and inflation data is scheduled for the second week of February. EUR/USD battles to remain afloat above 1.1800, sellers moving to the sidelines.

GBP/USD reclaims 1.3600 and above
GBP/USD reverses two straight days of losses, surpassing the key 1.3600 yardstick on Friday. Cable’s rebound comes as the Greenback slips away from two-week highs in response to some profit-taking mood and speculation of Fed rate cuts. In addition, hawkish comments from the BoE’s Pill are also collaborating with the quid’s improvement.

USD/JPY gathers strength to near 157.50 as Takaichi’s party wins snap elections
The USD/JPY pair attracts some buyers to around 157.45 during the early Asian session on Monday. The Japanese Yen weakens against the US Dollar after Japan’s ruling Liberal Democratic Party won an outright majority in Sunday’s lower house election, opening the door to more fiscal stimulus by Prime Minister Sanae Takaichi.
Editors’ Picks
USD/JPY gathers strength to near 157.50 as Takaichi’s party wins snap elections
The USD/JPY pair attracts some buyers to around 157.45 during the early Asian session on Monday. The Japanese Yen weakens against the US Dollar after Japan’s ruling Liberal Democratic Party won an outright majority in Sunday’s lower house election, opening the door to more fiscal stimulus by Prime Minister Sanae Takaichi.
EUR/USD: US Dollar to remain pressured until uncertainty fog dissipates
Unimpressive European Central Bank left monetary policy unchanged for the fifth consecutive meeting. The United States first-tier employment and inflation data is scheduled for the second week of February. EUR/USD battles to remain afloat above 1.1800, sellers moving to the sidelines.

Gold: Volatility persists in commodity space
After losing more than 8% to end the previous week, Gold remained under heavy selling pressure on Monday and dropped toward $4,400. Although XAU/USD staged a decisive rebound afterward, it failed to stabilize above $5,000. The US economic calendar will feature Nonfarm Payrolls and Consumer Price Index data for January, which could influence the market pricing of the Federal Reserve’s policy outlook and impact Gold’s performance.

Crypto Today: Bitcoin, Ethereum, XRP rebound amid risk-off, $2.6 billion liquidation wave
US NFP and CPI data awaited after Warsh’s nomination as Fed chief. Yen traders lock gaze on Sunday’s snap election. UK and Eurozone Q4 GDP data also on the agenda. China CPI and PPI could reveal more weakness in domestic demand.

Three scenarios for Japanese Yen ahead of snap election Premium
The latest polls point to a dominant win for the ruling bloc at the upcoming Japanese snap election. The larger Sanae Takaichi’s mandate, the more investors fear faster implementation of tax cuts and spending plans.
RECOMMENDED LESSONS
Making money in forex is easy if you know how the bankers trade!
I’m often mystified in my educational forex articles why so many traders struggle to make consistent money out of forex trading. The answer has more to do with what they don’t know than what they do know. After working in investment banks for 20 years many of which were as a Chief trader its second knowledge how to extract cash out of the market.
5 Forex News Events You Need To Know
In the fast moving world of currency markets where huge moves can seemingly come from nowhere, it is extremely important for new traders to learn about the various economic indicators and forex news events and releases that shape the markets. Indeed, quickly getting a handle on which data to look out for, what it means, and how to trade it can see new traders quickly become far more profitable and sets up the road to long term success.
Top 10 Chart Patterns Every Trader Should Know
Chart patterns are one of the most effective trading tools for a trader. They are pure price-action, and form on the basis of underlying buying and selling pressure. Chart patterns have a proven track-record, and traders use them to identify continuation or reversal signals, to open positions and identify price targets.
7 Ways to Avoid Forex Scams
The forex industry is recently seeing more and more scams. Here are 7 ways to avoid losing your money in such scams: Forex scams are becoming frequent. Michael Greenberg reports on luxurious expenses, including a submarine bought from the money taken from forex traders. Here’s another report of a forex fraud. So, how can we avoid falling in such forex scams?
What Are the 10 Fatal Mistakes Traders Make
Trading is exciting. Trading is hard. Trading is extremely hard. Some say that it takes more than 10,000 hours to master. Others believe that trading is the way to quick riches. They might be both wrong. What is important to know that no matter how experienced you are, mistakes will be part of the trading process.
The challenge: Timing the market and trader psychology
Successful trading often comes down to timing – entering and exiting trades at the right moments. Yet timing the market is notoriously difficult, largely because human psychology can derail even the best plans. Two powerful emotions in particular – fear and greed – tend to drive trading decisions off course.