Harmonic trading… let’s start from the beginning. H.M. Gartley was a prominent technical analysis that looked into specific retracement patterns. One of them bears his name to this day: the Gartley trading pattern.
In time, the original Gartley pattern suffered some changes. Technical analysis as we know it changed and will continue to change.
Think of personal computers, for example. A few decades back, technical analysis consisted of charting with pen and paper. Price action derived from real humans buying or selling.
Speaking of price action, while I do use strictly price action strategies, the aim of this article is to show different approaches to technical analysis. You’ll find out some of them are simply remarkable. As you have seen from my past articles, I am doing my best to show you the whole picture. I believe that is the best approach if you want to understand how other market participants are thinking, too. This will help you understand the market better as a whole.
Nowadays, supercomputers run complicated trading algorithms. They buy or sell financial products in a blink of an eye. They read the news in an instance and in the same moment take hundreds or more trades. No human does that.
As such, trading changed, and the approach to trading changed. The way traders use technical analysis changed. And it will continue changing along with future technological changes.
Harmonic trading as we know it today originated from Gartley’s work. Like in the case of Elliott Waves Theory, back in those years, the method derived from the stock market. If you apply the same Gartley principle to today’s Forex world, results will differ.
This is normal. Volatility differs, and the market is much bigger. While it reflects human behavior, this is “diluted” by the huge number of forces that drive prices. Back in 1950’s crowd behavior was easier to predict.
Defining the Gartley Pattern
The beauty of the original Gartley pattern comes from the money management system involved. Money management with Gartley allows for hefty 1:3, 1:4 or even more as risk-reward ratios.
When you think of harmonic trading, think of retracement levels. In a bullish setup, first, identify a strong bearish trend. Price action should see little or no retracement.
If you want a Fibonacci and Gartley approach, look for no swing above 61.8% of the previous move lower. The series of lower highs overwhelms. Bulls look trapped.
Gartley labeled this segment A-B. The longest in the pattern. And then, suddenly, bulls catch a bid. This is the B-C segment.
How do we know this bounce matters? The answer comes from the A-B characteristics: the lower highs series gets broken by the B-C segment.
Typically, when the B-C happens, traders begin to cover their short positions. When the short covering ends, the B-C ends.
This is where the Gartley trade kicks in. He noticed that:
By the time the B-C move ends, the price sees a small decline between 33% and 50% of the B-C length. That’s the entry place for a long trade.
The decline makes sense from a crowd behavior. The bears that missed the A-B decline waited for a meaningful pullback (the B-C) to sell short.
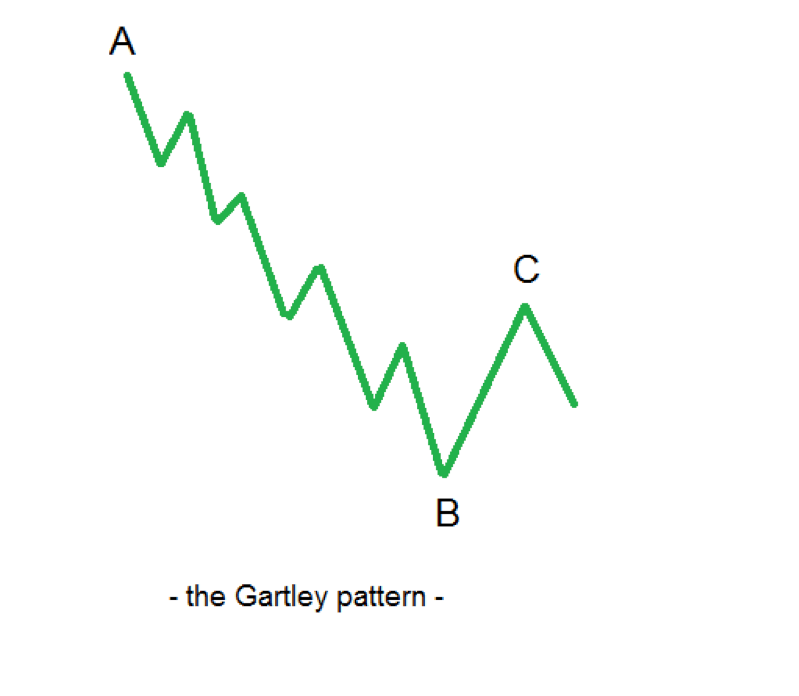
That minor decline after the B-C segment ends gives the entry on the long side. The B lows give the stop loss and 1:3, 1:4 risk-reward ratios result.
Important: It is not by chance that the risk-reward ratio is so big. It shows that the pattern fails quite often.
>>>Because of that, in time, various technical analysts made changes to the original Gartley pattern. And so, harmonic trading appeared.
Gartley 222
Larry Pesavento took Gartley’s original work to a new level. Because of him, the Gartley 222 pattern became a well-known harmonic pattern today.
The “Gartley 222” method as described by Pesavento derives its name from the page no. 222 from the original Harold’s Gartley’s book.
Here are some traits of this method:
-
Three out of four trades end up in profit.
-
Risk-reward ratio is bigger than 1:4
-
Traders end up riding a trend, not picking up a top or a bottom
The most simplistic representation of the Gartley 222 pattern looks like this:
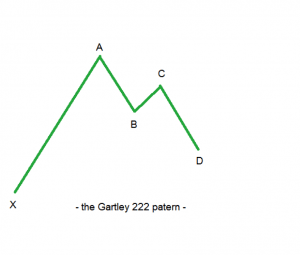
Pesavento developed the following rules for it:
-
75% of the time, the move from A will terminate at D at around 61.8%-78.6% retracement of XA distance.
-
25% of the time end of D will be at 38.2%, 50% or 70.7% of the XA distance
-
AB=CD
-
BC= 61.8%*AB or 78.6%*AB
On top of these, Pesavento found that sometimes the AB=CD rule gives a price target that stretches beyond point X. When this happens, the move will further continue in the same direction.
Moreover, when the AB=CD gives a price target around the X point, a double or a triple pattern forms most of the times.
While the Pesavento approach is clearly a step forward to harmonic trading, it was not enough. It still leaves a lot of room for interpretation.
Scott Carney in Harmonic Trading…
Carney was a student of Pesavento. He didn’t like to leave to many possibilities for the retracement levels, so he worked on finding a better approach.
Carney’s approach to harmonic trading was made public at the turn of the century. His approach uses specific Fibonacci ratios between the Pesavento’s Gartley 222 pattern.
For example:
-
B=61.8% of XA
-
BC<161.8%
-
AB=CD
The Carney’s harmonic trading rules look like the following:
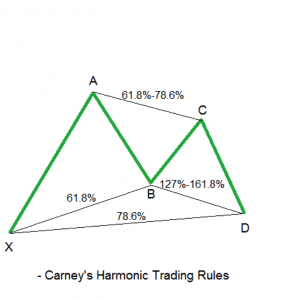
This is the base for modern harmonic trading. Bullish butterflies, bearish bats or crabs, and so on…the very definition of these patterns derives from Carney’s approach to the original Gartley pattern.
Conclusion
Nowadays, automated software spots bullish or bearish Gartley patterns. Moreover, on the MT4 Platform and other trading platforms, a sound alarm signals when such a pattern appears.
Traders need to know that harmonic patterns work best with a sound money management system. Before defining the target, one must deal with the potential loss.
For this, risk-reward ratios help traders survive in the market. Believe it or not, the first task is to make sure you’re there to trade another day. Then, to make a profit.
Traders must understand what drives the Forex market. What is the reason for the market movements? Retail traders do not cause these moves.
NOTE: Statistically, only about 6% of the daily Forex turnover represents retail traders’ transactions. The rest comes from high-frequency trading, mergers, and acquisitions, brokers, liquidity providers, commercial and central banks, etc.
Because of that, traders need a stop loss for every trade. Moreover, a risk-reward ratio that makes sense. Harmonic patterns provide them both.
This material is written for educational purposes only. By no means do any of its contents recommend, advocate or urge the buying, selling or holding of any financial instrument whatsoever. Trading and Investing involves high levels of risk. The author expresses personal opinions and will not assume any responsibility whatsoever for the actions of the reader. The author may or may not have positions in Financial Instruments discussed in this newsletter. Future results can be dramatically different from the opinions expressed herein. Past performance does not guarantee future results.
Editors’ Picks

EUR/USD hits two-day highs near 1.1820
EUR/USD picks up pace and reaches two-day tops around 1.1820 at the end of the week. The pair’s move higher comes on the back of renewed weakness in the US Dollar amid growing talk that the Fed could deliver an interest rate cut as early as March. On the docket, the flash US Consumer Sentiment improves to 57.3 in February.

GBP/USD reclaims 1.3600 and above
GBP/USD reverses two straight days of losses, surpassing the key 1.3600 yardstick on Friday. Cable’s rebound comes as the Greenback slips away from two-week highs in response to some profit-taking mood and speculation of Fed rate cuts. In addition, hawkish comments from the BoE’s Pill are also collaborating with the quid’s improvement.

USD/JPY drops back below 157.00, as focus shifts to Japan snap election
USD/JPY is back in the red below 157.00 in the Asian session on Friday. The Japanese Yen recovers ground against the US Dollar amid some profit-taking ahead of Japan's snap general election on Sunday. The preliminary reading of the Michigan Consumer Sentiment Index report for February will be released later on Friday.
Editors’ Picks

EUR/USD: US Dollar to remain pressured until uncertainty fog dissipates Premium
The EUR/USD pair lost additional ground in the first week of February, settling at around 1.1820. The reversal lost momentum after the pair peaked at 1.2082 in January, its highest since mid-2021.

Gold: Volatility persists in commodity space Premium
After losing more than 8% to end the previous week, Gold (XAU/USD) remained under heavy selling pressure on Monday and dropped toward $4,400. Although XAU/USD staged a decisive rebound afterward, it failed to stabilize above $5,000.

GBP/USD: Pound Sterling tests key support ahead of a big week Premium
The Pound Sterling (GBP) changed course against the US Dollar (USD), with GBP/USD giving up nearly 200 pips in a dramatic correction.

Bitcoin: The worst may be behind us
Bitcoin (BTC) price recovers slightly, trading at $65,000 at the time of writing on Friday, after reaching a low of $60,000 during the early Asian trading session. The Crypto King remained under pressure so far this week, posting three consecutive weeks of losses exceeding 30%.

Three scenarios for Japanese Yen ahead of snap election Premium
The latest polls point to a dominant win for the ruling bloc at the upcoming Japanese snap election. The larger Sanae Takaichi’s mandate, the more investors fear faster implementation of tax cuts and spending plans.
RECOMMENDED LESSONS
Making money in forex is easy if you know how the bankers trade!
I’m often mystified in my educational forex articles why so many traders struggle to make consistent money out of forex trading. The answer has more to do with what they don’t know than what they do know. After working in investment banks for 20 years many of which were as a Chief trader its second knowledge how to extract cash out of the market.
5 Forex News Events You Need To Know
In the fast moving world of currency markets where huge moves can seemingly come from nowhere, it is extremely important for new traders to learn about the various economic indicators and forex news events and releases that shape the markets. Indeed, quickly getting a handle on which data to look out for, what it means, and how to trade it can see new traders quickly become far more profitable and sets up the road to long term success.
Top 10 Chart Patterns Every Trader Should Know
Chart patterns are one of the most effective trading tools for a trader. They are pure price-action, and form on the basis of underlying buying and selling pressure. Chart patterns have a proven track-record, and traders use them to identify continuation or reversal signals, to open positions and identify price targets.
7 Ways to Avoid Forex Scams
The forex industry is recently seeing more and more scams. Here are 7 ways to avoid losing your money in such scams: Forex scams are becoming frequent. Michael Greenberg reports on luxurious expenses, including a submarine bought from the money taken from forex traders. Here’s another report of a forex fraud. So, how can we avoid falling in such forex scams?
What Are the 10 Fatal Mistakes Traders Make
Trading is exciting. Trading is hard. Trading is extremely hard. Some say that it takes more than 10,000 hours to master. Others believe that trading is the way to quick riches. They might be both wrong. What is important to know that no matter how experienced you are, mistakes will be part of the trading process.
The challenge: Timing the market and trader psychology
Successful trading often comes down to timing – entering and exiting trades at the right moments. Yet timing the market is notoriously difficult, largely because human psychology can derail even the best plans. Two powerful emotions in particular – fear and greed – tend to drive trading decisions off course.